Windstream 2011 Annual Report Download - page 186
Download and view the complete annual report
Please find page 186 of the 2011 Windstream annual report below. You can navigate through the pages in the report by either clicking on the pages listed below, or by using the keyword search tool below to find specific information within the annual report.-
 1
1 -
2
-
3
-
4
-
5
-
6
-
7
-
8
-
9
-
10
-
11
-
12
-
13
-
14
-
15
-
16
-
17
-
18
-
19
-
20
-
21
-
22
-
23
-
24
-
25
-
26
-
27
-
28
-
29
-
30
-
31
-
32
-
33
-
34
-
35
-
36
-
37
-
38
-
39
-
40
-
41
-
42
-
43
-
44
-
45
-
46
-
47
-
48
-
49
-
50
-
51
-
52
-
53
-
54
-
55
-
56
-
57
-
58
-
59
-
60
-
61
-
62
-
63
-
64
-
65
-
66
-
67
-
68
-
69
-
70
-
71
-
72
-
73
-
74
-
75
-
76
-
77
-
78
-
79
-
80
-
81
-
82
-
83
-
84
-
85
-
86
-
87
-
88
-
89
-
90
-
91
-
92
-
93
-
94
-
95
-
96
-
97
-
98
-
99
-
100
-
101
-
102
-
103
-
104
-
105
-
106
-
107
-
108
-
109
-
110
-
111
-
112
-
113
-
114
-
115
-
116
-
117
-
118
-
119
-
120
-
121
-
122
-
123
-
124
-
125
-
126
-
127
-
128
-
129
-
130
-
131
-
132
-
133
-
134
-
135
-
136
-
137
-
138
-
139
-
140
-
141
-
142
-
143
-
144
-
145
-
146
-
147
-
148
-
149
-
150
-
151
-
152
-
153
-
154
-
155
-
156
-
157
-
158
-
159
-
160
-
161
-
162
-
163
-
164
-
165
-
166
-
167
-
168
-
169
-
170
-
171
-
172
-
173
-
174
-
175
-
 176
176 -
 177
177 -
 178
178 -
 179
179 -
 180
180 -
 181
181 -
 182
182 -
 183
183 -
 184
184 -
 185
185 -
 186
186 -
 187
187 -
 188
188 -
 189
189 -
 190
190 -
 191
191 -
 192
192 -
 193
193 -
 194
194 -
 195
195 -
 196
196 -
197
-
198
-
199
-
200
 |
 |

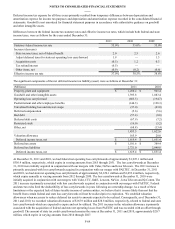
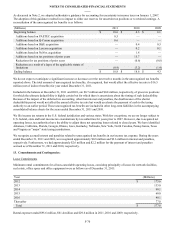
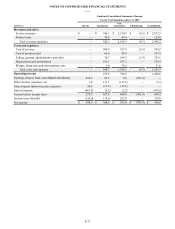
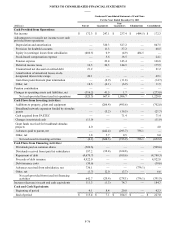
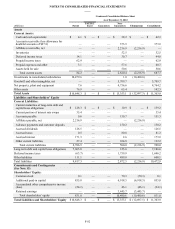
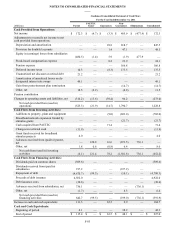
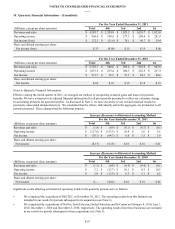
NOTES TO CONSOLIDATED FINANCIAL STATEMENTS
____
F-78
(Millions)
Cash Provided from Operations:
Net income
Adjustments to reconcile net income to net cash
provided from operations:
Depreciation and amortization
Provision for doubtful accounts
Equity in (earnings) losses from subsidiaries
Stock-based compensation expense
Pension income
Deferred income taxes
Amortization of unrealized losses on de-designated
interest rate swaps
Other, net
Pension contribution
Changes in operating assets and liabilities, net
Net cash provided from (used in) operations
Cash Flows from Investing Activities:
Additions to property, plant and equipment
Acquisition of D&E, net of cash acquired
Acquisition of Lexcom, net of cash acquired
Advances received from (paid to) parent, net
Other, net
Net cash provided from (used in) investing
activities
Cash Flows from Financing Activities:
Dividends paid on common shares
Dividends received from (paid to) subsidiaries
Stock repurchase
Repayment of debt
Proceeds of debt issuance
Debt issuance costs
Advances received from (paid to) subsidiaries, net
Other, net
Net cash provided from (used in) financing
activities
Increase in cash and cash equivalents
Cash and Cash Equivalents:
Beginning of period
End of period
Condensed Consolidated Statement of Cash Flows
For the Year Ended December 31, 2009
Parent
$ 398.5
—
—
(638.9)
—
—
40.4
0.6
4.0
(3.3)
20.4
(178.3)
—
(56.6)
(138.7)
—
—
(195.3)
(437.4)
224.7
(121.3)
(163.9)
1,083.6
(33.8)
581.6
3.8
1,137.3
763.7
282.8
$ 1,046.5
Guarantors
$ 308.8
191.1
10.4
(62.3)
2.0
(6.8)
20.3
—
1.0
—
(60.9)
403.6
(71.1)
—
—
233.8
0.6
163.3
—
(43.5)
—
(182.7)
—
—
—
(340.5)
(566.7)
0.2
1.0
$ 1.2
Non-
Guarantors
$ 393.0
347.2
33.6
(0.6)
15.4
(17.0)
59.1
—
5.7
—
47.9
884.3
(215.8)
—
—
(815.4)
—
(1,031.2)
—
(181.2)
—
(10.0)
—
—
—
340.5
149.3
2.4
12.8
$ 15.2
Eliminations
$(701.8)
—
—
701.8
—
—
—
—
—
—
—
—
—
—
—
581.6
—
581.6
—
—
—
—
—
—
(581.6)
—
(581.6)
—
—
$—
Consolidated
$ 398.5
538.3
44.0
—
17.4
(23.8)
119.8
0.6
10.7
(3.3)
7.4
1,109.6
(286.9)
(56.6)
(138.7)
—
0.6
(481.6)
(437.4)
—
(121.3)
(356.6)
1,083.6
(33.8)
—
3.8
138.3
766.3
296.6
$ 1,062.9