Windstream 2011 Annual Report Download - page 156
Download and view the complete annual report
Please find page 156 of the 2011 Windstream annual report below. You can navigate through the pages in the report by either clicking on the pages listed below, or by using the keyword search tool below to find specific information within the annual report.-
 1
1 -
2
-
3
-
4
-
5
-
6
-
7
-
8
-
9
-
10
-
11
-
12
-
13
-
14
-
15
-
16
-
17
-
18
-
19
-
20
-
21
-
22
-
23
-
24
-
25
-
26
-
27
-
28
-
29
-
30
-
31
-
32
-
33
-
34
-
35
-
36
-
37
-
38
-
39
-
40
-
41
-
42
-
43
-
44
-
45
-
46
-
47
-
48
-
49
-
50
-
51
-
52
-
53
-
54
-
55
-
56
-
57
-
58
-
59
-
60
-
61
-
62
-
63
-
64
-
65
-
66
-
67
-
68
-
69
-
70
-
71
-
72
-
73
-
74
-
75
-
76
-
77
-
78
-
79
-
80
-
81
-
82
-
83
-
84
-
85
-
86
-
87
-
88
-
89
-
90
-
91
-
92
-
93
-
94
-
95
-
96
-
97
-
98
-
99
-
100
-
101
-
102
-
103
-
104
-
105
-
106
-
107
-
108
-
109
-
110
-
111
-
112
-
113
-
114
-
115
-
116
-
117
-
118
-
119
-
120
-
121
-
122
-
123
-
124
-
125
-
126
-
127
-
128
-
129
-
130
-
131
-
132
-
133
-
134
-
135
-
136
-
137
-
138
-
139
-
140
-
141
-
142
-
143
-
144
-
145
-
 146
146 -
 147
147 -
 148
148 -
 149
149 -
 150
150 -
 151
151 -
 152
152 -
 153
153 -
 154
154 -
 155
155 -
 156
156 -
 157
157 -
 158
158 -
 159
159 -
 160
160 -
 161
161 -
 162
162 -
 163
163 -
 164
164 -
 165
165 -
 166
166 -
167
-
168
-
169
-
170
-
171
-
172
-
173
-
174
-
175
-
176
-
177
-
178
-
179
-
180
-
181
-
182
-
183
-
184
-
185
-
186
-
187
-
188
-
189
-
190
-
191
-
192
-
193
-
194
-
195
-
196
-
197
-
198
-
199
-
200
 |
 |

NOTES TO CONSOLIDATED FINANCIAL STATEMENTS
____
F-48
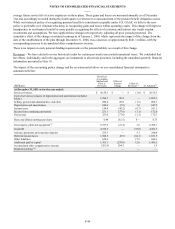
The pro forma results are presented for illustrative purposes only and do not reflect either the realization of potential cost
savings or any related integration costs. Certain cost savings may result from the PAETEC merger, although there can be no
assurance that cost savings will be achieved. These pro forma results do not purport to be indicative of the results that would
have actually been obtained if the merger had occurred as of the date indicated, nor do the pro forma results intend to be a
projection of results that may be obtained in the future.
Acquisition of Q-Comm – On December 2, 2010, we completed the acquisition of Q-Comm Corporation ("Q-Comm"), a
privately held regional fiber transport and business communications provider. This acquisition significantly enhanced our fiber
network with increased scale and business revenues, as well as the opportunity for operating synergies across our markets.
Under the terms of the merger agreement, we paid $279.1 million in cash, net of cash acquired, and issued approximately
20.6 million shares of our common stock valued at $271.6 million to acquire all of the issued and outstanding shares of Q-
Comm common stock. We also repaid $266.2 million in outstanding indebtedness and related liabilities on existing swap
agreements of Q-Comm. The transaction included Q-Comm’s wholly-owned subsidiaries Kentucky Data Link, Inc. (“KDL”), a
fiber services provider in 23 states and the District of Columbia, and Norlight, Inc. (“Norlight”), a business communications
provider serving approximately 5,500 business customers.
Acquisition of Hosted Solutions – On December 1, 2010, we completed the acquisition of Hosted Solutions in an all-cash
transaction valued at $312.8 million, which included a $2.8 million net working capital adjustment, net of cash acquired. We
financed the transaction through cash reserves and revolving credit capacity. Hosted Solutions, based in Raleigh, N.C., is a
leading regional data center and managed hosting provider focused on enterprise-class Infrastructure as a Service (IaaS)
solutions. This acquisition provided us with five state-of-the-art data centers in Raleigh, NC, Charlotte, NC, and Boston, MA
which serve more than 600 customers.
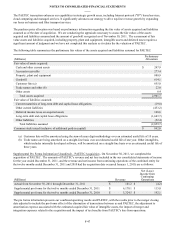
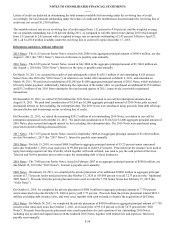
The following table summarizes the final fair values of the assets acquired and liabilities assumed for Hosted Solutions and Q-
Comm. Adjustments to the preliminary purchase price allocation were based on updated information regarding the fair value of
assets acquired and liabilities assumed as of the date of acquisition and were primarily associated with changes in current assets
and liabilities, intangible assets and deferred taxes that existed as of the date of the acquisition.
(Millions)
Fair value of assets acquired:
Current assets
Property, plant and equipment
Goodwill
Customer lists (a)
Non-compete agreements (b)
Trade names (c)
Other assets
Total assets acquired
Fair value of liabilities assumed:
Current maturities of long-term debt
Other current liabilities
Deferred income taxes on acquired assets
Other liabilities
Total liabilities assumed
Common stock issued (inclusive of additional paid-in capital)
Cash paid, net of cash acquired
Hosted
Solutions
Final
Allocation
$ 6.8
40.7
175.7
87.8
7.4
1.3
2.2
321.9
—
(6.3)
—
(2.8)
(9.1)
—
$ 312.8
Q-Comm
Final
Allocation
$ 35.4
293.5
358.0
292.5
—
3.7
19.6
1,002.7
(255.1)
(55.0)
(117.9)
(24.0)
(452.0)
(271.6)
$ 279.1
(a) Customer lists will be amortized using the sum-of-years digit methodology over an estimated useful life of 13 years
for Hosted Solutions and 15 years for Q-Comm.
(b) Non-compete agreements will be amortized on a straight-line basis over and estimated useful life of three years.
(c) Trade names are being amortized on a straight-line basis over an estimated useful life of one year.