Windstream 2011 Annual Report Download - page 119
Download and view the complete annual report
Please find page 119 of the 2011 Windstream annual report below. You can navigate through the pages in the report by either clicking on the pages listed below, or by using the keyword search tool below to find specific information within the annual report.-
 1
1 -
2
-
3
-
4
-
5
-
6
-
7
-
8
-
9
-
10
-
11
-
12
-
13
-
14
-
15
-
16
-
17
-
18
-
19
-
20
-
21
-
22
-
23
-
24
-
25
-
26
-
27
-
28
-
29
-
30
-
31
-
32
-
33
-
34
-
35
-
36
-
37
-
38
-
39
-
40
-
41
-
42
-
43
-
44
-
45
-
46
-
47
-
48
-
49
-
50
-
51
-
52
-
53
-
54
-
55
-
56
-
57
-
58
-
59
-
60
-
61
-
62
-
63
-
64
-
65
-
66
-
67
-
68
-
69
-
70
-
71
-
72
-
73
-
74
-
75
-
76
-
77
-
78
-
79
-
80
-
81
-
82
-
83
-
84
-
85
-
86
-
87
-
88
-
89
-
90
-
91
-
92
-
93
-
94
-
95
-
96
-
97
-
98
-
99
-
100
-
101
-
102
-
103
-
104
-
105
-
106
-
107
-
108
-
 109
109 -
 110
110 -
 111
111 -
 112
112 -
 113
113 -
 114
114 -
 115
115 -
 116
116 -
 117
117 -
 118
118 -
 119
119 -
 120
120 -
 121
121 -
 122
122 -
 123
123 -
 124
124 -
 125
125 -
 126
126 -
 127
127 -
 128
128 -
 129
129 -
130
-
131
-
132
-
133
-
134
-
135
-
136
-
137
-
138
-
139
-
140
-
141
-
142
-
143
-
144
-
145
-
146
-
147
-
148
-
149
-
150
-
151
-
152
-
153
-
154
-
155
-
156
-
157
-
158
-
159
-
160
-
161
-
162
-
163
-
164
-
165
-
166
-
167
-
168
-
169
-
170
-
171
-
172
-
173
-
174
-
175
-
176
-
177
-
178
-
179
-
180
-
181
-
182
-
183
-
184
-
185
-
186
-
187
-
188
-
189
-
190
-
191
-
192
-
193
-
194
-
195
-
196
-
197
-
198
-
199
-
200
 |
 |

F-11
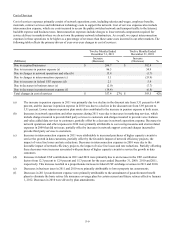
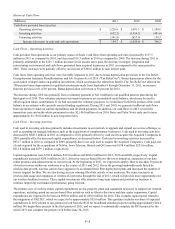
Depreciation and Amortization Expense
Depreciation and amortization expense primarily includes the depreciation of our plant assets and the amortization of our
intangible assets. The following table reflects the primary drivers of year-over-year changes in depreciation and amortization
expense:
(Millions)
Due to depreciation of acquired businesses plant assets
Due to amortization of intangible assets acquired in the
purchase of acquired businesses
Due to changes in depreciation expense (a)
Due to decreases in amortization expense (b)
Total changes in depreciation and amortization expense
Twelve Months Ended
December 31, 2011
Increase
(Decrease)
$ 58.2
87.8
28.8
(21.0)
$ 153.8
%
22%
Twelve Months Ended
December 31, 2010
Increase
(Decrease)
$ 88.5
79.8
(1.7)
(11.2)
$ 155.4
%
29%
(a) Increases in depreciation expense in 2011 were primarily due to additions in property, plant and equipment.
(b) Decreases in amortization expense were due to the use of accelerated amortization methods.
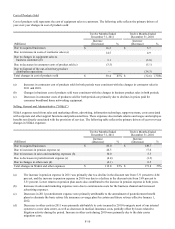
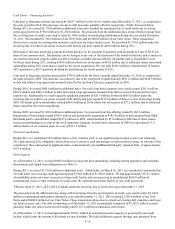
Merger, Integration and Restructuring Costs
We incur a significant amount of costs to complete a merger or acquisition and integrate its operations into our business. These
costs are presented as merger and integration expense in our results of operations and include transaction costs such as banker
and legal fees, employee-related costs such as severance, system conversion and rebranding costs. Our recent acquisitions
described in the section "Strategic Transactions" drive merger and integration costs for the years presented.
Restructuring charges are sometimes incurred as a result of evaluations of our operating structure. Among other things, these
evaluations explore opportunities for task automation, network efficiency and the balancing of our workforce based on the
current needs of our customers. Severance, lease exit costs and other related charges are included in restructuring charges.
Merger, integration and restructuring costs are unpredictable by nature but should not necessarily be viewed as non-recurring.
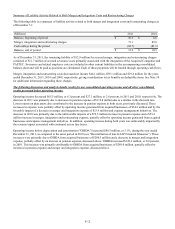
Set forth below is a summary of restructuring and merger and integration costs for the years ended December 31:
(Millions)
Merger and integration costs
Transaction costs associated with acquisitions (a)
Employee related transition costs (b)
Computer system and conversion costs
Signage and other rebranding costs
Total merger and integration costs
Restructuring charges
Total merger, integration and restructuring charges
2011
$ 40.7
22.3
5.7
1.1
69.8
1.3
$ 71.1
2010
$ 41.2
26.7
4.2
5.2
77.3
7.7
$ 85.0
2009
$ 11.4
8.6
1.6
0.7
22.3
9.3
$ 31.6
(a) Transaction costs in 2011 and 2010 primarily relate to accounting, legal, broker fees and other miscellaneous costs
associated with the acquisitions of PAETEC and the Acquired Companies, respectively. These costs are considered
indirect or general and are expensed when incurred.
(b) Employee related transition costs primarily consists of severance related to the integration of PAETEC and the
Acquired Companies.