Windstream 2011 Annual Report Download - page 137
Download and view the complete annual report
Please find page 137 of the 2011 Windstream annual report below. You can navigate through the pages in the report by either clicking on the pages listed below, or by using the keyword search tool below to find specific information within the annual report.-
 1
1 -
2
-
3
-
4
-
5
-
6
-
7
-
8
-
9
-
10
-
11
-
12
-
13
-
14
-
15
-
16
-
17
-
18
-
19
-
20
-
21
-
22
-
23
-
24
-
25
-
26
-
27
-
28
-
29
-
30
-
31
-
32
-
33
-
34
-
35
-
36
-
37
-
38
-
39
-
40
-
41
-
42
-
43
-
44
-
45
-
46
-
47
-
48
-
49
-
50
-
51
-
52
-
53
-
54
-
55
-
56
-
57
-
58
-
59
-
60
-
61
-
62
-
63
-
64
-
65
-
66
-
67
-
68
-
69
-
70
-
71
-
72
-
73
-
74
-
75
-
76
-
77
-
78
-
79
-
80
-
81
-
82
-
83
-
84
-
85
-
86
-
87
-
88
-
89
-
90
-
91
-
92
-
93
-
94
-
95
-
96
-
97
-
98
-
99
-
100
-
101
-
102
-
103
-
104
-
105
-
106
-
107
-
108
-
109
-
110
-
111
-
112
-
113
-
114
-
115
-
116
-
117
-
118
-
119
-
120
-
121
-
122
-
123
-
124
-
125
-
126
-
 127
127 -
 128
128 -
 129
129 -
 130
130 -
 131
131 -
 132
132 -
 133
133 -
 134
134 -
 135
135 -
 136
136 -
 137
137 -
 138
138 -
 139
139 -
 140
140 -
 141
141 -
 142
142 -
 143
143 -
 144
144 -
 145
145 -
 146
146 -
 147
147 -
148
-
149
-
150
-
151
-
152
-
153
-
154
-
155
-
156
-
157
-
158
-
159
-
160
-
161
-
162
-
163
-
164
-
165
-
166
-
167
-
168
-
169
-
170
-
171
-
172
-
173
-
174
-
175
-
176
-
177
-
178
-
179
-
180
-
181
-
182
-
183
-
184
-
185
-
186
-
187
-
188
-
189
-
190
-
191
-
192
-
193
-
194
-
195
-
196
-
197
-
198
-
199
-
200
 |
 |

F-29
SELECTED FINANCIAL DATA
(Millions, except per share amounts in thousands)
Revenues and sales
Operating income
Other (expense) income, net
Gain on sale of directory publishing business and other
assets
Loss on extinguishment of debt
Interest expense
Income from continuing operations before income taxes
Income taxes
Income from continuing operations
Discontinued operations, including tax expense (benefit)
of $0, ($10.6) and $0.5, for 2011, 2008 and 2007,
respectively
Net income
Basic and diluted earnings per share:
From continuing operations
From discontinued operations
Net income
Dividends declared per common share
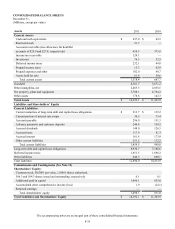
Balance sheet data
Total assets
Total long-term debt (including current maturities)
Total equity
2011
$ 4,285.7
968.0
(0.1)
—
(136.1)
(558.3)
273.5
101.1
172.4
(0.1)
$ 172.3
$.33
—
$.33
$1.00
$ 14,392.1
$ 9,053.2
$ 1,498.1
2010
$ 3,710.7
1,033.5
(3.5)
—
—
(521.7)
508.3
195.6
312.7
—
$ 312.7
$.66
—
$.66
$1.00
$ 11,303.9
$ 7,365.5
$ 831.0
2009
$ 2,996.3
1,060.6
(1.1)
—
—
(410.2)
649.3
250.8
398.5
—
$ 398.5
$.91
—
$.91
$1.00
$ 9,113.7
$ 6,295.2
$ 255.9
2008
$ 3,170.2
741.6
2.1
—
—
(416.4)
327.3
133.5
193.8
(22.2)
$ 171.6
$.43
(.05)
$.38
$1.00
$ 7,988.4
$ 5,382.5
$ 254.6
2007
$ 3,243.7
1,204.5
11.1
451.3
—
(444.4)
1,222.5
272.4
950.1
0.7
$ 950.8
$2.00
—
$2.00
$1.00
$ 8,220.2
$ 5,355.5
$ 710.1
Notes to Selected Financial Information:
• Explanations for significant events affecting our historical operating trends during the periods 2009 through 2011 are
provided in Management’s Discussion and Analysis of Results of Operations and Financial Condition.
• Effective during the fourth quarter of 2011, we changed our method of recognizing actuarial gains and losses for
pension benefits. We have retrospectively adjusted financial information for all prior periods presented to reflect our
voluntary change in accounting principle for pension benefits. See Notes 2 and 8 to the consolidated financial
statements.
• During 2007, we incurred $4.6 million in restructuring costs from a workforce reduction plan and the announced
realignment of our business operations and customer service functions intended to improve overall support to our
customers. Of these charges, $4.1 million was paid in cash during the year. In addition, we incurred $3.7 million in
transaction costs to complete the split off of our directory publishing business and incurred approximately $1.3 million
in rebranding costs associated with the acquisition of CTC.