Windstream 2011 Annual Report Download - page 144
Download and view the complete annual report
Please find page 144 of the 2011 Windstream annual report below. You can navigate through the pages in the report by either clicking on the pages listed below, or by using the keyword search tool below to find specific information within the annual report.-
 1
1 -
2
-
3
-
4
-
5
-
6
-
7
-
8
-
9
-
10
-
11
-
12
-
13
-
14
-
15
-
16
-
17
-
18
-
19
-
20
-
21
-
22
-
23
-
24
-
25
-
26
-
27
-
28
-
29
-
30
-
31
-
32
-
33
-
34
-
35
-
36
-
37
-
38
-
39
-
40
-
41
-
42
-
43
-
44
-
45
-
46
-
47
-
48
-
49
-
50
-
51
-
52
-
53
-
54
-
55
-
56
-
57
-
58
-
59
-
60
-
61
-
62
-
63
-
64
-
65
-
66
-
67
-
68
-
69
-
70
-
71
-
72
-
73
-
74
-
75
-
76
-
77
-
78
-
79
-
80
-
81
-
82
-
83
-
84
-
85
-
86
-
87
-
88
-
89
-
90
-
91
-
92
-
93
-
94
-
95
-
96
-
97
-
98
-
99
-
100
-
101
-
102
-
103
-
104
-
105
-
106
-
107
-
108
-
109
-
110
-
111
-
112
-
113
-
114
-
115
-
116
-
117
-
118
-
119
-
120
-
121
-
122
-
123
-
124
-
125
-
126
-
127
-
128
-
129
-
130
-
131
-
132
-
133
-
 134
134 -
 135
135 -
 136
136 -
 137
137 -
 138
138 -
 139
139 -
 140
140 -
 141
141 -
 142
142 -
 143
143 -
 144
144 -
 145
145 -
 146
146 -
 147
147 -
 148
148 -
 149
149 -
 150
150 -
 151
151 -
 152
152 -
 153
153 -
 154
154 -
155
-
156
-
157
-
158
-
159
-
160
-
161
-
162
-
163
-
164
-
165
-
166
-
167
-
168
-
169
-
170
-
171
-
172
-
173
-
174
-
175
-
176
-
177
-
178
-
179
-
180
-
181
-
182
-
183
-
184
-
185
-
186
-
187
-
188
-
189
-
190
-
191
-
192
-
193
-
194
-
195
-
196
-
197
-
198
-
199
-
200
 |
 |

F-36
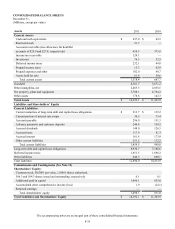
CONSOLIDATED STATEMENTS OF CASH FLOWS
For the years ended December 31,
(Millions)
Cash Provided from Operations:
Net income
Adjustments to reconcile net income to net cash provided from operations:
Depreciation and amortization
Provision for doubtful accounts
Stock-based compensation expense
Pension expense (income)
Deferred income taxes
Unamortized net discount on retired debt
Amortization of unrealized losses on de-designated interest rate swaps
Gain from postretirement plan termination
Other, net
Pension contribution
Changes in operating assets and liabilities, net
Accounts receivable
Income tax receivable
Prepaid income taxes
Prepaid expenses and other
Accounts payable
Accrued interest
Accrued taxes
Other current liabilities
Other liabilities
Other, net
Net cash provided from operations
Cash Flows from Investing Activities:
Additions to property, plant and equipment
Broadband network expansion funded by stimulus grants
Acquisition of D&E, net of cash acquired
Acquisition of Lexcom, net of cash acquired
Acquisition of NuVox, net of cash acquired
Acquisition of Iowa Telecom, net of cash acquired
Acquisition of Hosted Solutions, net of cash acquired
Acquisition of Q-Comm, net of cash acquired
Cash acquired from PAETEC
Changes in restricted cash
Grant funds received for broadband stimulus projects
Other, net
Net cash used in investing activities
Cash Flows from Financing Activities:
Dividends paid on common shares
Stock repurchase
Repayment of debt
Proceeds of debt issuance
Debt issuance costs
Other, net
Net cash (used in) provided from financing activities
Increase (decrease) in cash and cash equivalents
Cash and Cash Equivalents:
Beginning of period
End of period
Supplemental Cash Flow Disclosures:
Interest paid
Income taxes (refunded) paid, net
2011
$ 172.3
847.5
48.5
24.1
166.8
175.5
21.2
49.1
(14.7)
11.5
—
(64.3)
(124.1)
57.1
(5.6)
23.5
(99.1)
0.7
(30.3)
(4.4)
(26.5)
1,228.8
(702.0)
(21.7)
—
—
—
—
—
—
71.4
(11.9)
4.0
8.0
(652.2)
(509.6)
—
(4,780.3)
4,922.0
(30.6)
6.6
(391.9)
184.7
42.3
$ 227.0
$ 601.9
$ (11.1)
2010
$ 312.7
693.7
48.9
17.0
54.1
125.1
—
0.6
—
14.8
(41.7)
(42.8)
—
(46.6)
4.7
(18.1)
26.6
(10.1)
(1.1)
(30.3)
(16.2)
1,091.3
(412.0)
—
—
—
(198.4)
(253.6)
(312.8)
(279.1)
—
—
—
1.6
(1,454.3)
(464.6)
—
(1,715.0)
1,562.0
(21.8)
(18.2)
(657.6)
(1,020.6)
1,062.9
$ 42.3
$ 493.3
$ 120.6
2009
$ 398.5
538.3
44.0
17.4
(23.8)
119.8
—
0.6
—
10.7
(3.3)
(3.4)
—
0.3
(1.6)
(1.7)
4.4
12.6
(1.0)
(11.7)
9.5
1,109.6
(286.9)
—
(56.6)
(138.7)
—
—
—
—
—
—
—
0.6
(481.6)
(437.4)
(121.3)
(356.6)
1,083.6
(33.8)
3.8
138.3
766.3
296.6
$ 1,062.9
$ 395.5
$ 118.7
The accompanying notes are an integral part of these consolidated financial statements.