Windstream 2011 Annual Report Download - page 188
Download and view the complete annual report
Please find page 188 of the 2011 Windstream annual report below. You can navigate through the pages in the report by either clicking on the pages listed below, or by using the keyword search tool below to find specific information within the annual report.-
 1
1 -
2
-
3
-
4
-
5
-
6
-
7
-
8
-
9
-
10
-
11
-
12
-
13
-
14
-
15
-
16
-
17
-
18
-
19
-
20
-
21
-
22
-
23
-
24
-
25
-
26
-
27
-
28
-
29
-
30
-
31
-
32
-
33
-
34
-
35
-
36
-
37
-
38
-
39
-
40
-
41
-
42
-
43
-
44
-
45
-
46
-
47
-
48
-
49
-
50
-
51
-
52
-
53
-
54
-
55
-
56
-
57
-
58
-
59
-
60
-
61
-
62
-
63
-
64
-
65
-
66
-
67
-
68
-
69
-
70
-
71
-
72
-
73
-
74
-
75
-
76
-
77
-
78
-
79
-
80
-
81
-
82
-
83
-
84
-
85
-
86
-
87
-
88
-
89
-
90
-
91
-
92
-
93
-
94
-
95
-
96
-
97
-
98
-
99
-
100
-
101
-
102
-
103
-
104
-
105
-
106
-
107
-
108
-
109
-
110
-
111
-
112
-
113
-
114
-
115
-
116
-
117
-
118
-
119
-
120
-
121
-
122
-
123
-
124
-
125
-
126
-
127
-
128
-
129
-
130
-
131
-
132
-
133
-
134
-
135
-
136
-
137
-
138
-
139
-
140
-
141
-
142
-
143
-
144
-
145
-
146
-
147
-
148
-
149
-
150
-
151
-
152
-
153
-
154
-
155
-
156
-
157
-
158
-
159
-
160
-
161
-
162
-
163
-
164
-
165
-
166
-
167
-
168
-
169
-
170
-
171
-
172
-
173
-
174
-
175
-
176
-
177
-
 178
178 -
 179
179 -
 180
180 -
 181
181 -
 182
182 -
 183
183 -
 184
184 -
 185
185 -
 186
186 -
 187
187 -
 188
188 -
 189
189 -
 190
190 -
 191
191 -
 192
192 -
 193
193 -
 194
194 -
 195
195 -
 196
196 -
 197
197 -
 198
198 -
199
-
200
 |
 |

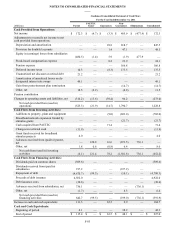
NOTES TO CONSOLIDATED FINANCIAL STATEMENTS
____
F-80
(Millions)
Revenues and sales:
Service revenues
Product sales
Total revenues and sales
Costs and expenses:
Cost of services
Cost of products sold
Selling, general, administrative and other
Depreciation and amortization
Merger, integration and restructuring costs
Total costs and expenses
Operating income
Earnings (losses) from consolidated
subsidiaries
Other income (expense), net
Intercompany interest income (expense)
Interest expense
Income before income taxes
Income taxes (benefit)
Net income
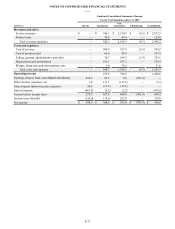
Condensed Consolidated Statement of Income
For the Year Ended December 31, 2010
Parent
$—
—
—
—
—
—
—
—
—
—
575.0
(2.2)
120.9
(514.0)
179.7
(133.0)
$ 312.7
PAETEC
Issuer
$—
—
—
—
—
—
—
—
—
—
—
—
—
—
—
—
$—
Guarantors
$—
—
—
—
—
—
—
—
—
—
—
—
—
—
—
—
$—
Non-
Guarantors
$ 3,621.4
89.3
3,710.7
1,327.7
74.9
495.9
693.7
85.0
2,677.2
1,033.5
—
(1.3)
(120.9)
(7.7)
903.6
328.6
$ 575.0
Eliminations
$—
—
—
—
—
—
—
—
—
—
(575.0)
—
—
—
(575.0)
—
$(575.0)
Consolidated
$ 3,621.4
89.3
3,710.7
1,327.7
74.9
495.9
693.7
85.0
2,677.2
1,033.5
—
(3.5)
—
(521.7)
508.3
195.6
$ 312.7
(Millions)
Revenues and sales:
Service revenues
Product sales
Total revenues and sales
Costs and expenses:
Cost of services
Cost of products sold
Selling, general, administrative and other
Depreciation and amortization
Merger, integration and restructuring costs
Total costs and expenses
Operating income
Earnings (losses) from consolidated
subsidiaries
Other income (expense), net
Intercompany interest income (expense)
Interest expense
Income before income taxes
Income taxes (benefit)
Net income
Condensed Consolidated Statement of Income
For the Year Ended December 31, 2009
Parent
$—
—
—
—
—
—
—
—
—
—
638.9
1.0
36.4
(401.8)
274.5
(124.0)
$ 398.5
PAETEC
Issuer
$—
—
—
—
—
—
—
—
—
—
—
—
—
—
—
—
$—
Guarantors
$—
—
—
—
—
—
—
—
—
—
—
—
—
—
—
—
$—
Non-
Guarantors
$ 2,872.5
123.8
2,996.3
934.2
107.5
324.1
538.3
31.6
1,935.7
1,060.6
—
(2.1)
(36.4)
(8.4)
1,013.7
374.8
$ 638.9
Eliminations
$—
—
—
—
—
—
—
—
—
—
(638.9)
—
—
—
(638.9)
—
$(638.9)
Consolidated
$ 2,872.5
123.8
2,996.3
934.2
107.5
324.1
538.3
31.6
1,935.7
1,060.6
—
(1.1)
—
(410.2)
649.3
250.8
$ 398.5