Windstream 2011 Annual Report Download - page 91
Download and view the complete annual report
Please find page 91 of the 2011 Windstream annual report below. You can navigate through the pages in the report by either clicking on the pages listed below, or by using the keyword search tool below to find specific information within the annual report.-
 1
1 -
2
-
3
-
4
-
5
-
6
-
7
-
8
-
9
-
10
-
11
-
12
-
13
-
14
-
15
-
16
-
17
-
18
-
19
-
20
-
21
-
22
-
23
-
24
-
25
-
26
-
27
-
28
-
29
-
30
-
31
-
32
-
33
-
34
-
35
-
36
-
37
-
38
-
39
-
40
-
41
-
42
-
43
-
44
-
45
-
46
-
47
-
48
-
49
-
50
-
51
-
52
-
53
-
54
-
55
-
56
-
57
-
58
-
59
-
60
-
61
-
62
-
63
-
64
-
65
-
66
-
67
-
68
-
69
-
70
-
71
-
72
-
73
-
74
-
75
-
76
-
77
-
78
-
79
-
80
-
 81
81 -
 82
82 -
 83
83 -
 84
84 -
 85
85 -
 86
86 -
 87
87 -
 88
88 -
 89
89 -
 90
90 -
 91
91 -
 92
92 -
 93
93 -
 94
94 -
 95
95 -
 96
96 -
 97
97 -
 98
98 -
 99
99 -
 100
100 -
 101
101 -
102
-
103
-
104
-
105
-
106
-
107
-
108
-
109
-
110
-
111
-
112
-
113
-
114
-
115
-
116
-
117
-
118
-
119
-
120
-
121
-
122
-
123
-
124
-
125
-
126
-
127
-
128
-
129
-
130
-
131
-
132
-
133
-
134
-
135
-
136
-
137
-
138
-
139
-
140
-
141
-
142
-
143
-
144
-
145
-
146
-
147
-
148
-
149
-
150
-
151
-
152
-
153
-
154
-
155
-
156
-
157
-
158
-
159
-
160
-
161
-
162
-
163
-
164
-
165
-
166
-
167
-
168
-
169
-
170
-
171
-
172
-
173
-
174
-
175
-
176
-
177
-
178
-
179
-
180
-
181
-
182
-
183
-
184
-
185
-
186
-
187
-
188
-
189
-
190
-
191
-
192
-
193
-
194
-
195
-
196
-
197
-
198
-
199
-
200
 |
 |

19
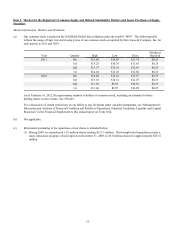
Item 5. Market for the Registrant’s Common Equity and Related Stockholder Matters and Issuer Purchases of Equity
Securities
Market Information, Holders and Dividends
(a) Our common stock is traded on the NASDAQ Global Select Market under the symbol “WIN”. The following table
reflects the range of high, low and closing prices of our common stock as reported by Dow Jones & Company, Inc. for
each quarter in 2011 and 2010:
Year
2011
2010
Quarter
4th
3rd
2nd
1st
4th
3rd
2nd
1st
High
$12.60
$13.25
$13.57
$14.04
$14.40
$13.05
$11.50
$11.40
Low
$10.88
$10.76
$12.38
$12.05
$12.10
$10.34
$6.02
$9.87
Close
$11.74
$11.65
$12.96
$12.88
$13.97
$12.29
$10.56
$10.89
Dividend
Declared
$0.25
$0.25
$0.25
$0.25
$0.25
$0.25
$0.25
$0.25
As of February 16, 2012, the approximate number of holders of common stock, including an estimate for those
holding shares in street name, was 236,649.
For a discussion of certain restrictions on our ability to pay dividends under our debt instruments, see “Management’s
Discussion and Analysis of Financial Condition and Results of Operations, Financial Condition, Liquidity and Capital
Resources” in the Financial Supplement to this annual report on Form 10-K.
(b) Not applicable.
(c) Information pertaining to the repurchase of our shares is included below.
(1) During 2009, we repurchased 13.0 million shares totaling $121.3 million. This brought total repurchases under a
stock repurchase program, which expired on December 31, 2009, to 29.0 million shares for approximately $321.6
million.