Windstream 2011 Annual Report Download - page 176
Download and view the complete annual report
Please find page 176 of the 2011 Windstream annual report below. You can navigate through the pages in the report by either clicking on the pages listed below, or by using the keyword search tool below to find specific information within the annual report.-
 1
1 -
2
-
3
-
4
-
5
-
6
-
7
-
8
-
9
-
10
-
11
-
12
-
13
-
14
-
15
-
16
-
17
-
18
-
19
-
20
-
21
-
22
-
23
-
24
-
25
-
26
-
27
-
28
-
29
-
30
-
31
-
32
-
33
-
34
-
35
-
36
-
37
-
38
-
39
-
40
-
41
-
42
-
43
-
44
-
45
-
46
-
47
-
48
-
49
-
50
-
51
-
52
-
53
-
54
-
55
-
56
-
57
-
58
-
59
-
60
-
61
-
62
-
63
-
64
-
65
-
66
-
67
-
68
-
69
-
70
-
71
-
72
-
73
-
74
-
75
-
76
-
77
-
78
-
79
-
80
-
81
-
82
-
83
-
84
-
85
-
86
-
87
-
88
-
89
-
90
-
91
-
92
-
93
-
94
-
95
-
96
-
97
-
98
-
99
-
100
-
101
-
102
-
103
-
104
-
105
-
106
-
107
-
108
-
109
-
110
-
111
-
112
-
113
-
114
-
115
-
116
-
117
-
118
-
119
-
120
-
121
-
122
-
123
-
124
-
125
-
126
-
127
-
128
-
129
-
130
-
131
-
132
-
133
-
134
-
135
-
136
-
137
-
138
-
139
-
140
-
141
-
142
-
143
-
144
-
145
-
146
-
147
-
148
-
149
-
150
-
151
-
152
-
153
-
154
-
155
-
156
-
157
-
158
-
159
-
160
-
161
-
162
-
163
-
164
-
165
-
 166
166 -
 167
167 -
 168
168 -
 169
169 -
 170
170 -
 171
171 -
 172
172 -
 173
173 -
 174
174 -
 175
175 -
 176
176 -
 177
177 -
 178
178 -
 179
179 -
 180
180 -
 181
181 -
 182
182 -
 183
183 -
 184
184 -
 185
185 -
 186
186 -
187
-
188
-
189
-
190
-
191
-
192
-
193
-
194
-
195
-
196
-
197
-
198
-
199
-
200
 |
 |

NOTES TO CONSOLIDATED FINANCIAL STATEMENTS
____
F-68
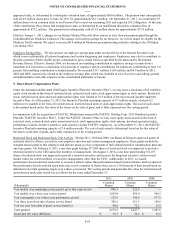
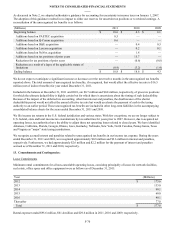
The following is a summary of the merger, integration and restructuring charges recorded for the years ended December 31:
(Millions)
Merger and integration costs
Transaction costs associated with acquisitions
Employee related transition costs
Computer system and conversion costs
Signage and other rebranding costs
Total merger and integration costs
Restructuring charges
Total merger, integration and restructuring charges
2011
$ 40.7
22.3
5.7
1.1
69.8
1.3
$ 71.1
2010
$ 41.2
26.7
4.2
5.2
77.3
7.7
$ 85.0
2009
$ 11.4
8.6
1.6
0.7
22.3
9.3
$ 31.6
Merger, integration and restructuring charges decreased net income $44.1 million, $59.1 million and $19.4 million for the years
ended December 31, 2011, 2010 and 2009, respectively, giving consideration to tax benefits on deductible items.
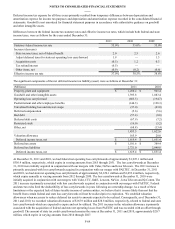
The following is a summary of the activity related to the liabilities associated with our merger, integration and restructuring
charges at December 31:
(Millions)
Balance, beginning of period
Merger, integration and restructuring charges
Cash outlays during the period
Balance, end of period
2011
$ 10.5
71.1
(68.7)
$ 12.9
2010
$ 6.6
85.0
(81.1)
$ 10.5
As of December 31, 2011, other current liabilities included the remaining liability of $12.9 million for accrued merger,
integration and restructuring charges. This included $11.7 million of accrued severance costs primarily associated with the
integration of PAETEC and the Acquired Companies. The severance and related employee costs will be paid as positions are
eliminated. Each of these payments will be funded through operating cash flows.
11. Accumulated Other Comprehensive Income:
Accumulated other comprehensive income (loss) balances, net of tax, were as follows for the years ended December 31:
(Millions)
Pension and postretirement plans
Unrealized holding losses on interest rate swaps
Designated portion
De-designated portion
Accumulated other comprehensive income (loss)
2011
$ 54.7
(16.6)
(36.2)
$ 1.9
2010
$ 38.9
3.5
(66.5)
$(24.1)
2009
$ 49.3
(66.5)
(1.4)
$(18.6)
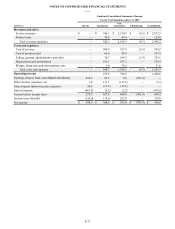
12. Income Taxes:
Income tax expense was as follows for the years ended December 31:
(Millions)
Current:
Federal
State
Deferred:
Federal
State
Income tax expense
2011
$(97.8)
23.4
(74.4)
181.8
(6.3)
175.5
$ 101.1
2010
$ 71.3
(0.8)
70.5
104.5
20.6
125.1
$ 195.6
2009
$ 120.2
10.8
131.0
91.8
28.0
119.8
$ 250.8