Windstream 2011 Annual Report Download - page 116
Download and view the complete annual report
Please find page 116 of the 2011 Windstream annual report below. You can navigate through the pages in the report by either clicking on the pages listed below, or by using the keyword search tool below to find specific information within the annual report.-
 1
1 -
2
-
3
-
4
-
5
-
6
-
7
-
8
-
9
-
10
-
11
-
12
-
13
-
14
-
15
-
16
-
17
-
18
-
19
-
20
-
21
-
22
-
23
-
24
-
25
-
26
-
27
-
28
-
29
-
30
-
31
-
32
-
33
-
34
-
35
-
36
-
37
-
38
-
39
-
40
-
41
-
42
-
43
-
44
-
45
-
46
-
47
-
48
-
49
-
50
-
51
-
52
-
53
-
54
-
55
-
56
-
57
-
58
-
59
-
60
-
61
-
62
-
63
-
64
-
65
-
66
-
67
-
68
-
69
-
70
-
71
-
72
-
73
-
74
-
75
-
76
-
77
-
78
-
79
-
80
-
81
-
82
-
83
-
84
-
85
-
86
-
87
-
88
-
89
-
90
-
91
-
92
-
93
-
94
-
95
-
96
-
97
-
98
-
99
-
100
-
101
-
102
-
103
-
104
-
105
-
 106
106 -
 107
107 -
 108
108 -
 109
109 -
 110
110 -
 111
111 -
 112
112 -
 113
113 -
 114
114 -
 115
115 -
 116
116 -
 117
117 -
 118
118 -
 119
119 -
 120
120 -
 121
121 -
 122
122 -
 123
123 -
 124
124 -
 125
125 -
 126
126 -
127
-
128
-
129
-
130
-
131
-
132
-
133
-
134
-
135
-
136
-
137
-
138
-
139
-
140
-
141
-
142
-
143
-
144
-
145
-
146
-
147
-
148
-
149
-
150
-
151
-
152
-
153
-
154
-
155
-
156
-
157
-
158
-
159
-
160
-
161
-
162
-
163
-
164
-
165
-
166
-
167
-
168
-
169
-
170
-
171
-
172
-
173
-
174
-
175
-
176
-
177
-
178
-
179
-
180
-
181
-
182
-
183
-
184
-
185
-
186
-
187
-
188
-
189
-
190
-
191
-
192
-
193
-
194
-
195
-
196
-
197
-
198
-
199
-
200
 |
 |

F-8
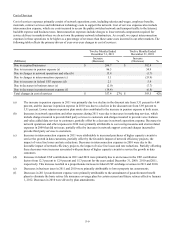
(c) Decreases in state USF revenues in 2011 were attributable to the decline in access lines and eligible recoverable costs
in that period. Increases in state USF revenues in 2010 were primarily due to an increase in costs recoverable under
the program.
(d) Decreases in switched access revenues in 2011 and 2010 were primarily due to continued declines in voice lines and
the phased reduction of interstate access rates for our subsidiaries that converted to price cap regulation and have not
reached the Federal Communications Commission's (“FCC”) prescribed target rate. Additional declines in switched
access revenues, in 2010, were due to a network efficiency project which maximizes the use of our own network for
transporting long-distance traffic in order to decrease our interconnection expense, which has reduced switched access
revenues earned from the underlying long-distance carriers.
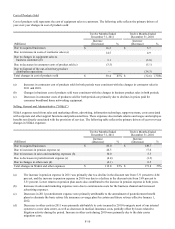
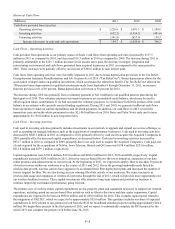
Other Service Revenues
Other service revenues include revenues from certain consumer markets where we no longer offer new service, software and
other miscellaneous services. As a result of our decision to stop offering new service in certain consumer markets, we expect
other service revenues to decline as current customers disconnect.
The following table reflects the primary drivers of year-over-year changes in other service revenues:
(Millions)
Due to acquired businesses
Due to changes in other (a)
Total changes in other revenues
Twelve Months Ended
December 31, 2011
Increase
(Decrease)
$ 14.4
(11.0)
$ 3.4
%
7%
Twelve Months Ended
December 31, 2010
Increase
(Decrease)
$ 18.0
(9.5)
$ 8.5
%
22%
(a) Decreases in other revenue were primarily attributable to decreases in consumer service and other rent revenue.
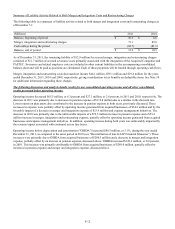
Product Sales
Product sales include data and communications equipment sold to business customers and high-speed Internet modems, home
networking equipment, computers and other equipment sold to consumers. In addition, we sell network equipment to
contractors on a wholesale basis. The following table reflects the primary drivers of year-over-year changes in product sales:
(Millions)
Due to acquired businesses
Due to increases in contractor sales (a)
Due to changes in business product sales (b)
Due to increases in consumer product sales
Due to disposal of the out-of-territory product
distribution operations
Total changes in product sales
Twelve Months Ended
December 31, 2011
Increase
(Decrease)
$ 20.8
14.5
3.5
1.1
—
$ 39.9
%
45%
Twelve Months Ended
December 31, 2010
Increase
(Decrease)
$ 7.8
1.3
(5.9)
—
(37.7)
$(34.5)
%
(28)%
(a) Increases in contractor sales in 2011 were primarily due to increased sales of outside plant materials. Increases in
contractor sales in 2010 were due to modest increases experienced during the second half of 2010 associated with
increased infrastructure activity.
(b) Increases of business product sales in 2011 were driven by increased sales of equipment associated with growing
demand for business services. Decreases in business product sales in 2010 were primarily due to lower demand for
these products, which we believe was attributable to the postponement of purchasing decisions by some businesses as
a result of continued weakness in the overall economic environment. We experienced modest increases across all
product sales during the second half of 2010.