Windstream 2011 Annual Report Download - page 172
Download and view the complete annual report
Please find page 172 of the 2011 Windstream annual report below. You can navigate through the pages in the report by either clicking on the pages listed below, or by using the keyword search tool below to find specific information within the annual report.-
 1
1 -
2
-
3
-
4
-
5
-
6
-
7
-
8
-
9
-
10
-
11
-
12
-
13
-
14
-
15
-
16
-
17
-
18
-
19
-
20
-
21
-
22
-
23
-
24
-
25
-
26
-
27
-
28
-
29
-
30
-
31
-
32
-
33
-
34
-
35
-
36
-
37
-
38
-
39
-
40
-
41
-
42
-
43
-
44
-
45
-
46
-
47
-
48
-
49
-
50
-
51
-
52
-
53
-
54
-
55
-
56
-
57
-
58
-
59
-
60
-
61
-
62
-
63
-
64
-
65
-
66
-
67
-
68
-
69
-
70
-
71
-
72
-
73
-
74
-
75
-
76
-
77
-
78
-
79
-
80
-
81
-
82
-
83
-
84
-
85
-
86
-
87
-
88
-
89
-
90
-
91
-
92
-
93
-
94
-
95
-
96
-
97
-
98
-
99
-
100
-
101
-
102
-
103
-
104
-
105
-
106
-
107
-
108
-
109
-
110
-
111
-
112
-
113
-
114
-
115
-
116
-
117
-
118
-
119
-
120
-
121
-
122
-
123
-
124
-
125
-
126
-
127
-
128
-
129
-
130
-
131
-
132
-
133
-
134
-
135
-
136
-
137
-
138
-
139
-
140
-
141
-
142
-
143
-
144
-
145
-
146
-
147
-
148
-
149
-
150
-
151
-
152
-
153
-
154
-
155
-
156
-
157
-
158
-
159
-
160
-
161
-
 162
162 -
 163
163 -
 164
164 -
 165
165 -
 166
166 -
 167
167 -
 168
168 -
 169
169 -
 170
170 -
 171
171 -
 172
172 -
 173
173 -
 174
174 -
 175
175 -
 176
176 -
 177
177 -
 178
178 -
 179
179 -
 180
180 -
 181
181 -
 182
182 -
183
-
184
-
185
-
186
-
187
-
188
-
189
-
190
-
191
-
192
-
193
-
194
-
195
-
196
-
197
-
198
-
199
-
200
 |
 |

NOTES TO CONSOLIDATED FINANCIAL STATEMENTS
____
F-64
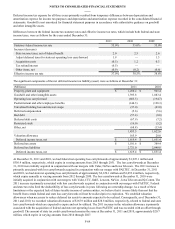
(a) Changes in the level 3 investments for the year ended December 31, 2011 are reflected in the table below. Changes for
the year ended December 31, 2010 were inconsequential.
(b) Valued at their quoted market price on the last day of the year. Securities traded in markets that are not considered
active are valued based on quoted market prices, broker or dealer quotes or alternative pricing sources with reasonable
levels of price transparency.
(c) Valued by reference to the funds’ underlying assets and are based on the unit values as reported by the fund manager
on the last business day of the year. The underlying assets are mostly comprised of publicly traded equity securities
and fixed income securities. These securities are valued at the official closing price of, or the last reported sale prices
as of the close of business or, in the absence of any sales, at the latest available bid price.
(d) Valued at fair value as determined by the investment managers. Private equity is initially valued by the investment
managers based upon cost, then adjusted for available market data based upon observations of the trading multiples of
public companies considered comparable to the private companies being valued. Such market data used to determine
adjustments to accounts for cash flows and company-specified issues include current operating performance and future
expectations of the investments, changes in market outlook, and the third-party financing environment. Real estate
investments are valued either at amounts based upon appraisal reports prepared by independent third-party appraisers
or at amounts as determined by internal appraisals performed by the investment manager, which has been agreed to by
an external valuation consultant.
(e) Based on the value of the underlying contracts adjusted to market value, which recognizes that either long-term assets
would have to be sold before contract maturity or new contributions by other contract holders would have to be
exchanged for funds being transferred, precluding these contributions from being invested at the current rate of return.
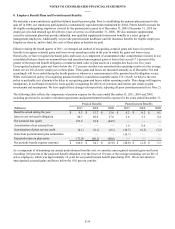
The following is a reconciliation of the beginning and ending balances of pension plan assets that are measured at fair value
using significant unobservable inputs:
(Millions)
Balance at December 31, 2010
Actual (loss) gain on plan assets
Purchases and sales
Transfers in and/or out of level 3
Balance at December 31, 2011
Domestic
equities
$ 0.2
(0.1)
—
—
$ 0.1
Real estate and
private equity
funds
$—
2.4
31.0
—
$ 33.4
Guaranteed
annuity
contract
$ 3.3
0.2
(0.7)
—
$ 2.8
Total
$ 3.5
2.5
30.3
—
$ 36.3
There have been no significant changes in the methodology used to value investments from prior year. The valuation methods
used may produce a fair value calculation that may not be indicative of net realizable value or reflective of future fair values.
Furthermore, although the valuation methods are consistent with other market participants, the use of different methodologies
or assumptions to determine the fair value of certain financial instruments could result in a different fair value measurement at
the reporting date.
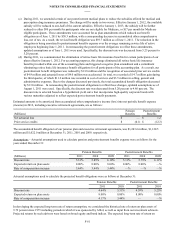
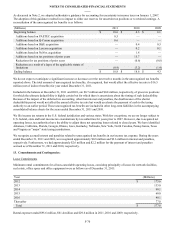
Estimated Future Employer Contributions and Benefit Payments – Estimated future employer contributions, benefit payments,
including executive retirement agreements, are as follows as of December 31, 2011:
(Millions)
Expected employer contributions in 2012
Expected benefit payments:
2012
2013
2014
2015
2016
2017-2021
Pension
Benefits
$ 0.7
$ 73.6
75.0
77.6
78.2
80.5
428.4
Postretirement
Benefits
$ 5.1
$ 5.1
3.5
3.6
3.5
3.4
13.7
The 2012 expected employer contribution of $0.7 million for pension benefits represents the amount necessary to fund the
expected benefit payments related to the unfunded supplemental executive retirement pension plans. On February 28, 2011, we
contributed 4.9 million shares of our common stock to our Pension Plan. At the time of this contribution, these shares had an