Windstream 2011 Annual Report Download - page 115
Download and view the complete annual report
Please find page 115 of the 2011 Windstream annual report below. You can navigate through the pages in the report by either clicking on the pages listed below, or by using the keyword search tool below to find specific information within the annual report.-
 1
1 -
2
-
3
-
4
-
5
-
6
-
7
-
8
-
9
-
10
-
11
-
12
-
13
-
14
-
15
-
16
-
17
-
18
-
19
-
20
-
21
-
22
-
23
-
24
-
25
-
26
-
27
-
28
-
29
-
30
-
31
-
32
-
33
-
34
-
35
-
36
-
37
-
38
-
39
-
40
-
41
-
42
-
43
-
44
-
45
-
46
-
47
-
48
-
49
-
50
-
51
-
52
-
53
-
54
-
55
-
56
-
57
-
58
-
59
-
60
-
61
-
62
-
63
-
64
-
65
-
66
-
67
-
68
-
69
-
70
-
71
-
72
-
73
-
74
-
75
-
76
-
77
-
78
-
79
-
80
-
81
-
82
-
83
-
84
-
85
-
86
-
87
-
88
-
89
-
90
-
91
-
92
-
93
-
94
-
95
-
96
-
97
-
98
-
99
-
100
-
101
-
102
-
103
-
104
-
 105
105 -
 106
106 -
 107
107 -
 108
108 -
 109
109 -
 110
110 -
 111
111 -
 112
112 -
 113
113 -
 114
114 -
 115
115 -
 116
116 -
 117
117 -
 118
118 -
 119
119 -
 120
120 -
 121
121 -
 122
122 -
 123
123 -
 124
124 -
 125
125 -
126
-
127
-
128
-
129
-
130
-
131
-
132
-
133
-
134
-
135
-
136
-
137
-
138
-
139
-
140
-
141
-
142
-
143
-
144
-
145
-
146
-
147
-
148
-
149
-
150
-
151
-
152
-
153
-
154
-
155
-
156
-
157
-
158
-
159
-
160
-
161
-
162
-
163
-
164
-
165
-
166
-
167
-
168
-
169
-
170
-
171
-
172
-
173
-
174
-
175
-
176
-
177
-
178
-
179
-
180
-
181
-
182
-
183
-
184
-
185
-
186
-
187
-
188
-
189
-
190
-
191
-
192
-
193
-
194
-
195
-
196
-
197
-
198
-
199
-
200
 |
 |

F-7
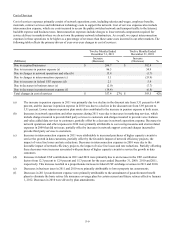
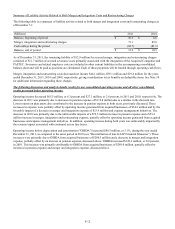
To combat competitive pressures in our markets, we emphasize our bundle service strategy and continue to enhance our
network to offer faster Internet speeds. Service bundles provide discounts and other incentives for customers to bundle their
voice, long distance, high-speed Internet and video services and have positively impacted our operating trends.
The following table reflects the primary drivers of year-over-year changes in consumer service revenues:
(Millions)
Due to acquired businesses
Due to increases in high-speed Internet revenues (a)
Due to changes in miscellaneous revenues
Due to decreases in voice and long distance revenues (b)
Total changes in consumer revenues
Twelve Months Ended
December 31, 2011
Increase
(Decrease)
$ 43.0
37.3
2.4
(75.3)
$ 7.4
%
1%
Twelve Months Ended
December 31, 2010
Increase
(Decrease)
$ 114.8
37.7
(0.2)
(81.4)
$ 70.9
%
5%
(a) Increases in high-speed Internet revenues were primarily due to the increase in high-speed Internet customers, continued
migration to higher speeds and increased sales of value added services, as previously discussed.
(b) Decreases in voice service revenues were primarily attributable to declines in voice lines.
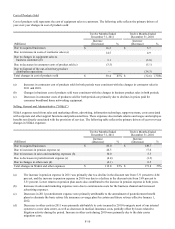
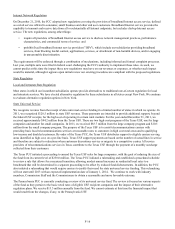
Wholesale Service Revenues
Wholesale service revenues include switched access revenues, Universal Service Fund ("USF") revenues and voice and data
services sold on a wholesale basis.
Switched access revenues include usage sensitive revenues from long distance companies and other carriers for access to our
network in connection with the completion of long distance calls, as well as reciprocal compensation received from wireless
and other local connecting carriers for the use of our facilities. USF revenues are government subsidies, collected from our
customers, designed to partially offset the cost of providing wireline services in high-cost areas. In addition, we offer our voice
and data services on a wholesale basis to other carriers.
Revenues from these services are expected to decline due to access line losses and reductions in switched access rates.
The following table reflects the primary drivers of year-over-year changes in wholesale service revenues:
(Millions)
Due to acquired businesses
Due to decreases in voice and other revenues (a)
Due to changes in federal USF revenues (b)
Due to changes in state USF revenues (c)
Due to decreases in switched access revenues (d)
Total changes in wholesale revenues
Twelve Months Ended
December 31, 2011
Increase
(Decrease)
$ 55.4
(1.1)
(4.5)
(7.3)
(37.8)
$ 4.7
%
1%
Twelve Months Ended
December 31, 2010
Increase
(Decrease)
$ 84.0
(1.5)
6.5
4.8
(36.8)
$ 57.0
%
10%
(a) Decreases in wholesale voice and miscellaneous revenues in 2010 were primarily due to the decline in payphone and
UNE voice lines.
(b) Decreases in federal USF revenues in 2011 resulted from decreases in federal funds received and line loss, partially
offset by increases in USF surcharge revenues, driven by an increase in the USF contribution factor from 12.9 percent
to 15.3 percent. Increases in federal USF revenues in 2010 were primarily due to an increase in USF surcharge
revenues of $6.5 million, driven by the increase in the USF contribution factor from 12.3 percent to 12.9 percent for
the years ended December 31, 2009 and 2010, respectively. The changes to the USF surcharge revenues resulted in a
proportionate change in federal USF expense included in cost of services below.