Windstream 2012 Annual Report Download - page 103
Download and view the complete annual report
Please find page 103 of the 2012 Windstream annual report below. You can navigate through the pages in the report by either clicking on the pages listed below, or by using the keyword search tool below to find specific information within the annual report.-
 1
1 -
2
-
3
-
4
-
5
-
6
-
7
-
8
-
9
-
10
-
11
-
12
-
13
-
14
-
15
-
16
-
17
-
18
-
19
-
20
-
21
-
22
-
23
-
24
-
25
-
26
-
27
-
28
-
29
-
30
-
31
-
32
-
33
-
34
-
35
-
36
-
37
-
38
-
39
-
40
-
41
-
42
-
43
-
44
-
45
-
46
-
47
-
48
-
49
-
50
-
51
-
52
-
53
-
54
-
55
-
56
-
57
-
58
-
59
-
60
-
61
-
62
-
63
-
64
-
65
-
66
-
67
-
68
-
69
-
70
-
71
-
72
-
73
-
74
-
75
-
76
-
77
-
78
-
79
-
80
-
81
-
82
-
83
-
84
-
85
-
86
-
87
-
88
-
89
-
90
-
91
-
92
-
 93
93 -
 94
94 -
 95
95 -
 96
96 -
 97
97 -
 98
98 -
 99
99 -
 100
100 -
 101
101 -
 102
102 -
 103
103 -
 104
104 -
 105
105 -
 106
106 -
 107
107 -
 108
108 -
 109
109 -
 110
110 -
 111
111 -
 112
112 -
 113
113 -
114
-
115
-
116
-
117
-
118
-
119
-
120
-
121
-
122
-
123
-
124
-
125
-
126
-
127
-
128
-
129
-
130
-
131
-
132
-
133
-
134
-
135
-
136
-
137
-
138
-
139
-
140
-
141
-
142
-
143
-
144
-
145
-
146
-
147
-
148
-
149
-
150
-
151
-
152
-
153
-
154
-
155
-
156
-
157
-
158
-
159
-
160
-
161
-
162
-
163
-
164
-
165
-
166
-
167
-
168
-
169
-
170
-
171
-
172
-
173
-
174
-
175
-
176
-
177
-
178
-
179
-
180
-
181
-
182
-
183
-
184
-
185
-
186
-
187
-
188
-
189
-
190
-
191
-
192
-
193
-
194
-
195
-
196
 |
 |

F-5
ORGANIZATION AND RESULTS OF OPERATIONS
We provide a wide range of telecom services, from advanced data solutions for businesses to basic voice services. Our sales,
marketing and customer support teams are structured based upon the type of customer they serve. We deliver these services
over owned or leased network facilities. Our corporate support teams, such as finance and accounting, human resources and
legal, support our operations as a whole. See a detailed discussion and analysis of revenues and sales in our discussion below of
consolidated operating results.
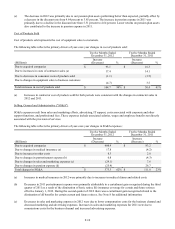
The following table reflects our consolidated operating results as of December 31:
(Dollars in millions) (a,b) 2012 2011 2010
Revenues and sales:
Service revenues:
Business $ 3,611.4 $ 2,098.0 $ 1,577.5
Consumer 1,339.5 1,378.3 1,372.8
Wholesale 708.0 547.3 555.9
Other 266.2 131.0 115.2
Total service revenues 5,925.1 4,154.6 3,621.4
Product sales 231.2 126.6 89.3
Total revenues and sales 6,156.3 4,281.2 3,710.7
Costs and expenses:
Cost of services (exclusive of depreciation and amortization included below) 2,692.4 1,691.1 1,331.9
Cost of products sold 210.0 105.3 74.9
Selling, general, and administrative 976.0 602.7 491.7
Depreciation and amortization 1,297.6 847.5 693.7
Merger and integration costs 65.4 69.8 77.3
Restructuring charges 27.4 1.3 7.7
Total costs and expenses 5,268.8 3,317.7 2,677.2
Operating income 887.5 963.5 1,033.5
Other income (expense), net 4.6 (0.1)(3.5)
Gain (loss) on early extinguishment of debt 1.9 (136.1)—
Interest expense (625.1)(558.3)(521.7)
Income from continuing operations before income taxes 268.9 269.0 508.3
Income taxes 100.2 99.4 195.6
Income from continuing operations 168.7 169.6 312.7
Discontinued operations, net of tax (0.7)(0.1)—
Net income $ 168.0 $ 169.5 $ 312.7
Operating Metrics: (Thousands)
Business Operating Metrics:
Customers
Enterprise 177.3 167.2 62.9
Small business 460.8 495.6 407.7
Total customers (c) 638.1 662.8 470.6
Carrier special access circuits 107.2 112.0 102.4
Consumer Operating Metrics:
Voice lines 1,841.9 1,927.9 2,012.4
High-speed Internet 1,214.5 1,207.8 1,159.1
Digital television customers 426.1 441.2 426.7
Total consumer connections 3,482.5 3,576.9 3,598.2
(a) Results from operations include post-acquisition results from NuVox, Iowa Telecom, Hosted Solutions, Q-Comm, and
PAETEC operations, (collectively known as the "Acquired Companies"). In the discussion and analysis provided
below regarding changes in consolidated revenues and expenses in 2012 and 2011, the impact of the acquisitions on