Windstream 2012 Annual Report Download - page 167
Download and view the complete annual report
Please find page 167 of the 2012 Windstream annual report below. You can navigate through the pages in the report by either clicking on the pages listed below, or by using the keyword search tool below to find specific information within the annual report.-
 1
1 -
2
-
3
-
4
-
5
-
6
-
7
-
8
-
9
-
10
-
11
-
12
-
13
-
14
-
15
-
16
-
17
-
18
-
19
-
20
-
21
-
22
-
23
-
24
-
25
-
26
-
27
-
28
-
29
-
30
-
31
-
32
-
33
-
34
-
35
-
36
-
37
-
38
-
39
-
40
-
41
-
42
-
43
-
44
-
45
-
46
-
47
-
48
-
49
-
50
-
51
-
52
-
53
-
54
-
55
-
56
-
57
-
58
-
59
-
60
-
61
-
62
-
63
-
64
-
65
-
66
-
67
-
68
-
69
-
70
-
71
-
72
-
73
-
74
-
75
-
76
-
77
-
78
-
79
-
80
-
81
-
82
-
83
-
84
-
85
-
86
-
87
-
88
-
89
-
90
-
91
-
92
-
93
-
94
-
95
-
96
-
97
-
98
-
99
-
100
-
101
-
102
-
103
-
104
-
105
-
106
-
107
-
108
-
109
-
110
-
111
-
112
-
113
-
114
-
115
-
116
-
117
-
118
-
119
-
120
-
121
-
122
-
123
-
124
-
125
-
126
-
127
-
128
-
129
-
130
-
131
-
132
-
133
-
134
-
135
-
136
-
137
-
138
-
139
-
140
-
141
-
142
-
143
-
144
-
145
-
146
-
147
-
148
-
149
-
150
-
151
-
152
-
153
-
154
-
155
-
156
-
 157
157 -
 158
158 -
 159
159 -
 160
160 -
 161
161 -
 162
162 -
 163
163 -
 164
164 -
 165
165 -
 166
166 -
 167
167 -
 168
168 -
 169
169 -
 170
170 -
 171
171 -
 172
172 -
 173
173 -
 174
174 -
 175
175 -
 176
176 -
 177
177 -
178
-
179
-
180
-
181
-
182
-
183
-
184
-
185
-
186
-
187
-
188
-
189
-
190
-
191
-
192
-
193
-
194
-
195
-
196
 |
 |

NOTES TO CONSOLIDATED FINANCIAL STATEMENTS
____
F-69
9. Share-Based Compensation Plans, Continued:
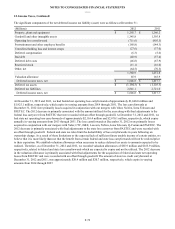
The aggregate intrinsic value in the table above represents the total pretax intrinsic value (the difference between the closing
sale price of Windstream's common stock as reported on the NASDAQ Global Select Market on December 31, 2012 and the
option exercise price, multiplied by the number of in-the-money options) that would have been received by the option holders
if all option holders had exercised their options on December 31, 2012. This amount changes based on the fair market value of
Windstream's common stock. The aggregate intrinsic value of options exercised during the year ended December 31, 2012 was
approximately $2.8 million.
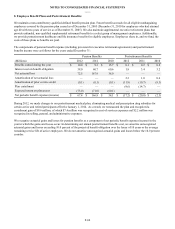
Total compensation expense related to stock options granted was approximately $0.2 million and $0.1 million for the years
ended December 31, 2012 and 2011, respectively.
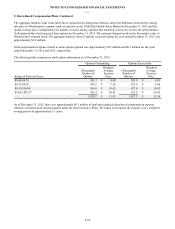
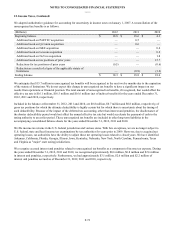
The following table summarizes stock option information as of December 31, 2012:
Options Outstanding Options Exercisable
Range of Exercise Prices
(Thousands)
Number of
Options
Weighted
Average
Exercise
Price
(Thousands)
Number of
Options
Weighted
Average
Exercise
Price
$0.00-$4.70 291.3 $ 4.00 283.9 $ 4.03
$4.71-$8.30 439.2 $ 7.26 323.9 $ 6.96
$8.31-$14.00 506.8 $ 10.62 427.4 $ 10.82
$14.01-$29.27 591.9 $ 20.42 591.9 $ 20.42
1,829.2 $ 11.93 1,627.1 $ 12.36
As of December 31, 2012, there was approximately $0.1 million of total unrecognized share-based compensation expense
related to unvested stock options granted under the Stock Incentive Plans. We expect to recognize the expense over a weighted
average period of approximately 1.1 years .