Windstream 2012 Annual Report Download - page 192
Download and view the complete annual report
Please find page 192 of the 2012 Windstream annual report below. You can navigate through the pages in the report by either clicking on the pages listed below, or by using the keyword search tool below to find specific information within the annual report.-
 1
1 -
2
-
3
-
4
-
5
-
6
-
7
-
8
-
9
-
10
-
11
-
12
-
13
-
14
-
15
-
16
-
17
-
18
-
19
-
20
-
21
-
22
-
23
-
24
-
25
-
26
-
27
-
28
-
29
-
30
-
31
-
32
-
33
-
34
-
35
-
36
-
37
-
38
-
39
-
40
-
41
-
42
-
43
-
44
-
45
-
46
-
47
-
48
-
49
-
50
-
51
-
52
-
53
-
54
-
55
-
56
-
57
-
58
-
59
-
60
-
61
-
62
-
63
-
64
-
65
-
66
-
67
-
68
-
69
-
70
-
71
-
72
-
73
-
74
-
75
-
76
-
77
-
78
-
79
-
80
-
81
-
82
-
83
-
84
-
85
-
86
-
87
-
88
-
89
-
90
-
91
-
92
-
93
-
94
-
95
-
96
-
97
-
98
-
99
-
100
-
101
-
102
-
103
-
104
-
105
-
106
-
107
-
108
-
109
-
110
-
111
-
112
-
113
-
114
-
115
-
116
-
117
-
118
-
119
-
120
-
121
-
122
-
123
-
124
-
125
-
126
-
127
-
128
-
129
-
130
-
131
-
132
-
133
-
134
-
135
-
136
-
137
-
138
-
139
-
140
-
141
-
142
-
143
-
144
-
145
-
146
-
147
-
148
-
149
-
150
-
151
-
152
-
153
-
154
-
155
-
156
-
157
-
158
-
159
-
160
-
161
-
162
-
163
-
164
-
165
-
166
-
167
-
168
-
169
-
170
-
171
-
172
-
173
-
174
-
175
-
176
-
177
-
178
-
179
-
180
-
181
-
 182
182 -
 183
183 -
 184
184 -
 185
185 -
 186
186 -
 187
187 -
 188
188 -
 189
189 -
 190
190 -
 191
191 -
 192
192 -
 193
193 -
 194
194 -
 195
195 -
 196
196
 |
 |

NOTES TO CONSOLIDATED FINANCIAL STATEMENTS
____
F-94
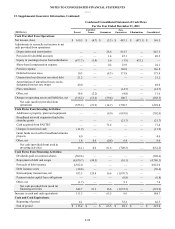
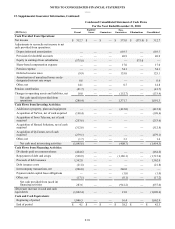
18. Quarterly Financial Information – (Unaudited), Continued:
(Millions, except per share amounts)
As
Previously
Reported
Effect of
Revision As Revised
For the quarter ended March 31, 2012
Consumer service revenues $ 338.0 $ (2.1) $ 335.9
Total service revenues 1,488.4 (2.1) 1,486.3
Product sales 56.8 (4.8) 52.0
Total revenues and sales 1,545.2 (6.9) 1,538.3
Income taxes 40.0 (2.7) 37.3
Income from continuing operations 64.7 (4.2) 60.5
Net income (loss) 64.6 (4.2) 60.4
Basic and diluted earnings per share:
Net income (loss) $.11 ($.01) $.10
(Millions, except per share amounts)
As
Previously
Reported
Effect of
Revision As Revised
For the quarter ended December 31, 2011
Consumer service revenues $ 341.4 $ (1.9) $ 339.5
Total service revenues 1,163.7 (1.9) 1,161.8
Product sales 46.1 (2.6) 43.5
Total revenues and sales 1,209.8 (4.5) 1,205.3
Income taxes (18.7)(1.7)(20.4)
Income from continuing operations (31.8)(2.8)(34.6)
Net income (loss) (31.9)(2.8)(34.7)
Basic and diluted earnings per share:
Net income (loss) ($.06)($.01)($.07)
(a) Includes $2.1 million of reclasses to conform with the current presentation.
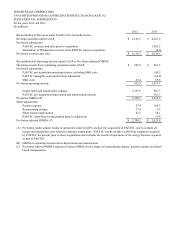
Significant events affecting our historical operating trends in the quarterly periods were as follows:
• We completed the acquisition of PAETEC on November 30, 2011. The operating results from this business are
included in our results for periods subsequent to its acquisition (see Note 3).