Windstream 2012 Annual Report Download - page 161
Download and view the complete annual report
Please find page 161 of the 2012 Windstream annual report below. You can navigate through the pages in the report by either clicking on the pages listed below, or by using the keyword search tool below to find specific information within the annual report.-
 1
1 -
2
-
3
-
4
-
5
-
6
-
7
-
8
-
9
-
10
-
11
-
12
-
13
-
14
-
15
-
16
-
17
-
18
-
19
-
20
-
21
-
22
-
23
-
24
-
25
-
26
-
27
-
28
-
29
-
30
-
31
-
32
-
33
-
34
-
35
-
36
-
37
-
38
-
39
-
40
-
41
-
42
-
43
-
44
-
45
-
46
-
47
-
48
-
49
-
50
-
51
-
52
-
53
-
54
-
55
-
56
-
57
-
58
-
59
-
60
-
61
-
62
-
63
-
64
-
65
-
66
-
67
-
68
-
69
-
70
-
71
-
72
-
73
-
74
-
75
-
76
-
77
-
78
-
79
-
80
-
81
-
82
-
83
-
84
-
85
-
86
-
87
-
88
-
89
-
90
-
91
-
92
-
93
-
94
-
95
-
96
-
97
-
98
-
99
-
100
-
101
-
102
-
103
-
104
-
105
-
106
-
107
-
108
-
109
-
110
-
111
-
112
-
113
-
114
-
115
-
116
-
117
-
118
-
119
-
120
-
121
-
122
-
123
-
124
-
125
-
126
-
127
-
128
-
129
-
130
-
131
-
132
-
133
-
134
-
135
-
136
-
137
-
138
-
139
-
140
-
141
-
142
-
143
-
144
-
145
-
146
-
147
-
148
-
149
-
150
-
 151
151 -
 152
152 -
 153
153 -
 154
154 -
 155
155 -
 156
156 -
 157
157 -
 158
158 -
 159
159 -
 160
160 -
 161
161 -
 162
162 -
 163
163 -
 164
164 -
 165
165 -
 166
166 -
 167
167 -
 168
168 -
 169
169 -
 170
170 -
 171
171 -
172
-
173
-
174
-
175
-
176
-
177
-
178
-
179
-
180
-
181
-
182
-
183
-
184
-
185
-
186
-
187
-
188
-
189
-
190
-
191
-
192
-
193
-
194
-
195
-
196
 |
 |

NOTES TO CONSOLIDATED FINANCIAL STATEMENTS
____
F-63
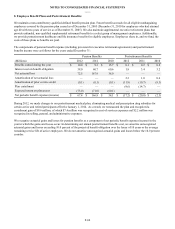
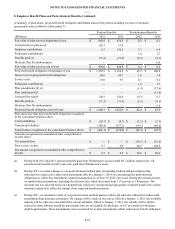
8. Employee Benefit Plans and Postretirement Benefits, Continued:
Information regarding the healthcare cost trend rate was as follows for the years ended December 31:
2012 2011
Healthcare cost trend rate assumed for next year 9.00% 9.00%
Rate that the cost trend ultimately declines to 5.00% 5.00%
Year that the rate reaches the terminal rate 2019 2017
For the year ended December 31, 2012, a one percent increase in the assumed healthcare cost trend rate would increase the
postretirement benefit cost by approximately $0.2 million, while a one percent decrease in the rate would reduce the
postretirement benefit cost by approximately $0.1 million. As of December 31, 2012, a one percent increase in the assumed
healthcare cost trend rate would increase the postretirement benefit obligation by approximately $3.0 million, while a one
percent decrease in the rate would reduce the postretirement benefit obligation by approximately $2.3 million.
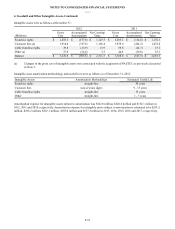
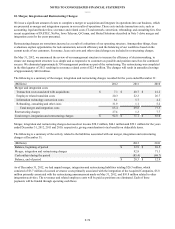
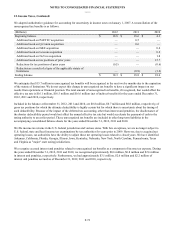
Plan Assets – Our pension plan assets are allocated to asset categories based on the specific strategy employed by the asset’s
investment manager. The asset allocation for our pension plan by asset category was as follows for the years ended December
31:
Target Allocation Percentage of Plan Assets
Asset Category 2013 2012 2011
Equity securities 18.6% - 30.6% 44.2% 50.8%
Fixed income securities 43.2% - 70.2% 33.8% 39.2%
Alternative investments 10.8% - 20.8% 4.4% 3.7%
Money market and other short-term interest bearing securities 3.0% - 3.0% 17.6% 6.3%
100.0% 100.0%
In 2012, we engaged a third party to evaluate the allocation of the total assets in the pension trust, taking into consideration the
pension liabilities and funded status of the pension plan. Assets are managed utilizing a Liability Driven Investment ("LDI")
approach, meaning that assets are managed within a risk management framework which addresses the need to generate
incremental returns in the context of an appropriate level of risk, based on plan liability profiles and changes in funded status.
The return objectives are to satisfy funding obligations when and as prescribed by law and to keep pace with the growth of the
pension plan liabilities. Given the long time horizon for paying out benefits and our strong financial condition, the pension plan
can accept an average level of risk relative to other similar plans. The liquidity needs of the pension plan are manageable given
that lump sum payments are not available to most participants.
Equity securities include stocks of both large and small capitalization domestic and international companies. Equity securities
are expected to provide both diversification and long-term real asset growth. Domestic equities may include modest holdings of
non-U.S. equities, purchased by domestic equity managers as long as they are traded in the U.S and denominated in U.S.
dollars and both active and passive (index) investment strategies. International equities provide a broad exposure to return
opportunities and investment characteristics associated with the world equity markets outside the U.S. The pension plan’s
equity holdings are diversified by investment style, market capitalization, market or region, and economic sector.
Fixed income securities include securities issued by the U.S. Government and other governmental agencies, asset-backed
securities and debt securities issued by domestic and international entities. These securities are expected to provide
diversification benefits, and are expected to reduce asset volatility and pension funding volatility, and a stable source of
income.
Alternative investments may include hedge funds and hedge fund of funds, commodities, both private and public real estate and
private equity investments. In addition to attractive diversification benefits, the alternative investments are expected to provide
both income and capital appreciation.
Investments in money market and other short-term interest bearing securities are maintained to provide liquidity for benefit
payments with protection of principal being the primary objective.