Windstream 2012 Annual Report Download - page 118
Download and view the complete annual report
Please find page 118 of the 2012 Windstream annual report below. You can navigate through the pages in the report by either clicking on the pages listed below, or by using the keyword search tool below to find specific information within the annual report.-
 1
1 -
2
-
3
-
4
-
5
-
6
-
7
-
8
-
9
-
10
-
11
-
12
-
13
-
14
-
15
-
16
-
17
-
18
-
19
-
20
-
21
-
22
-
23
-
24
-
25
-
26
-
27
-
28
-
29
-
30
-
31
-
32
-
33
-
34
-
35
-
36
-
37
-
38
-
39
-
40
-
41
-
42
-
43
-
44
-
45
-
46
-
47
-
48
-
49
-
50
-
51
-
52
-
53
-
54
-
55
-
56
-
57
-
58
-
59
-
60
-
61
-
62
-
63
-
64
-
65
-
66
-
67
-
68
-
69
-
70
-
71
-
72
-
73
-
74
-
75
-
76
-
77
-
78
-
79
-
80
-
81
-
82
-
83
-
84
-
85
-
86
-
87
-
88
-
89
-
90
-
91
-
92
-
93
-
94
-
95
-
96
-
97
-
98
-
99
-
100
-
101
-
102
-
103
-
104
-
105
-
106
-
107
-
 108
108 -
 109
109 -
 110
110 -
 111
111 -
 112
112 -
 113
113 -
 114
114 -
 115
115 -
 116
116 -
 117
117 -
 118
118 -
 119
119 -
 120
120 -
 121
121 -
 122
122 -
 123
123 -
 124
124 -
 125
125 -
 126
126 -
 127
127 -
 128
128 -
129
-
130
-
131
-
132
-
133
-
134
-
135
-
136
-
137
-
138
-
139
-
140
-
141
-
142
-
143
-
144
-
145
-
146
-
147
-
148
-
149
-
150
-
151
-
152
-
153
-
154
-
155
-
156
-
157
-
158
-
159
-
160
-
161
-
162
-
163
-
164
-
165
-
166
-
167
-
168
-
169
-
170
-
171
-
172
-
173
-
174
-
175
-
176
-
177
-
178
-
179
-
180
-
181
-
182
-
183
-
184
-
185
-
186
-
187
-
188
-
189
-
190
-
191
-
192
-
193
-
194
-
195
-
196
 |
 |

F-20
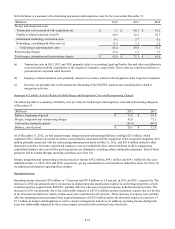
Cash Flows – Operating Activities
Cash provided from operations is our primary source of funds. Cash flows from operating activities increased by $548.8
million in 2012 as compared to 2011, and increased $137.5 million in 2011 as compared to 2010. The increase during 2012 is
primarily attributable to the $89.6 million increase in net income taxes refunded and cash flows generated from PAETEC.
These increases were partially offset by an increase of $69.6 million in cash interest paid.
Cash flows from operating activities were favorably impacted in 2012 due to bonus depreciation provisions in the Tax Relief,
Unemployment Insurance Reauthorization and Job Creation Act ("Tax Relief Act"). Bonus depreciation allows for the
acceleration of depreciation on qualified investments, which accelerates the related tax benefit. The Tax Relief Act allowed for
50 percent bonus depreciation for qualified investments made from December 31, 2011 through December 31, 2012. The
American Taxpayer Relief Act extended 50 percent bonus depreciation through 2013.
The increase in 2011 is primarily attributable to the $131.7 million decrease in net income taxes paid, the decrease in merger,
integration and restructuring costs incurred and cash flows generated from acquired companies in 2011 as compared to the
same period in 2010. These increases were partially offset by an increase of $108.6 million in cash interest paid.
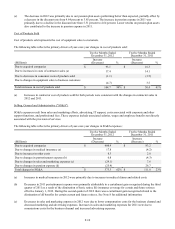
Cash Flows – Investing Activities
Cash used in investing activities primarily includes investments in our network to upgrade and expand our service offerings, as
well as spending on strategic initiatives such as the acquisition of complementary businesses. Cash used in investing activities
increased by $449.5 million in 2012 as compared to 2011, primarily driven by increased capital expenditures, as discussed
below. This increase was partially offset by approximately $57.0 million in proceeds from the disposition of wireless assets.
Cash used in investing activities decreased by $802.1 million in 2011 as compared to 2010, primarily due to cash used to
purchase the companies acquired in 2010, partially offset by increased capital expenditures, as discussed below. Cash paid, net
of cash acquired for the acquisitions of NuVox, Iowa Telecom, Hosted and Q-Comm was $198.4 million, $253.6 million,
$312.8 million and $279.1 million, respectively.
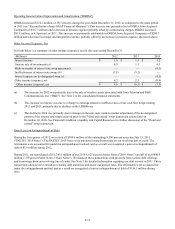
Capital expenditures were $1,101.2 million, $702.0 million and $412.0 million for 2012, 2011 and 2010, respectively. Capital
expenditures increased $399.2 million in 2012, driven by success-based fiber-to-the-tower initiatives, our portion of broadband
stimulus spend, expansion of our data center presence and enhancements to our network and the acquisition of PAETEC. Given
the growing bandwidth needs fueled by wireless data growth, wireless carriers have aggressively accelerated their fiber
deployment plans and increased the number of towers targeted for fiber. We expect increases in wireless data usage and
expansion of wireless 4G networks through the end of 2013, which will provide more opportunities for our wireless backhaul
services. We are currently executing on fiber to the tower projects we have won. These capital investments offer attractive long-
term returns and position our business to continue improving our financial performance going forward. While our capital spend
is elevated this year, beginning in 2013 we expect capital expenditures to decline as the fiber to the tower and stimulus projects
wind down.
Capital expenditures by category for the last two years are as follows:
(Millions) 2012 2011
Recurring capital expenditures $ 735.2 $ 555.3
Fiber to the tower and broadband stimulus 314.6 146.7
Integration capital expenditures $ 51.4 $ —
Total capital expenditures $ 1,101.2 $ 702.0
The primary uses of cash for future capital expenditures are for property, plant and equipment necessary to support our network
operations, including spend on success-based fiber initiatives such as fiber-to-the-tower and data center expansions. Capital
expenditures are expected to be between $800.0 million and $850.0 million for 2013.