Windstream 2012 Annual Report Download - page 33
Download and view the complete annual report
Please find page 33 of the 2012 Windstream annual report below. You can navigate through the pages in the report by either clicking on the pages listed below, or by using the keyword search tool below to find specific information within the annual report.-
 1
1 -
2
-
3
-
4
-
5
-
6
-
7
-
8
-
9
-
10
-
11
-
12
-
13
-
14
-
15
-
16
-
17
-
18
-
19
-
20
-
21
-
22
-
 23
23 -
 24
24 -
 25
25 -
 26
26 -
 27
27 -
 28
28 -
 29
29 -
 30
30 -
 31
31 -
 32
32 -
 33
33 -
 34
34 -
 35
35 -
 36
36 -
 37
37 -
 38
38 -
 39
39 -
 40
40 -
 41
41 -
 42
42 -
 43
43 -
44
-
45
-
46
-
47
-
48
-
49
-
50
-
51
-
52
-
53
-
54
-
55
-
56
-
57
-
58
-
59
-
60
-
61
-
62
-
63
-
64
-
65
-
66
-
67
-
68
-
69
-
70
-
71
-
72
-
73
-
74
-
75
-
76
-
77
-
78
-
79
-
80
-
81
-
82
-
83
-
84
-
85
-
86
-
87
-
88
-
89
-
90
-
91
-
92
-
93
-
94
-
95
-
96
-
97
-
98
-
99
-
100
-
101
-
102
-
103
-
104
-
105
-
106
-
107
-
108
-
109
-
110
-
111
-
112
-
113
-
114
-
115
-
116
-
117
-
118
-
119
-
120
-
121
-
122
-
123
-
124
-
125
-
126
-
127
-
128
-
129
-
130
-
131
-
132
-
133
-
134
-
135
-
136
-
137
-
138
-
139
-
140
-
141
-
142
-
143
-
144
-
145
-
146
-
147
-
148
-
149
-
150
-
151
-
152
-
153
-
154
-
155
-
156
-
157
-
158
-
159
-
160
-
161
-
162
-
163
-
164
-
165
-
166
-
167
-
168
-
169
-
170
-
171
-
172
-
173
-
174
-
175
-
176
-
177
-
178
-
179
-
180
-
181
-
182
-
183
-
184
-
185
-
186
-
187
-
188
-
189
-
190
-
191
-
192
-
193
-
194
-
195
-
196
 |
 |

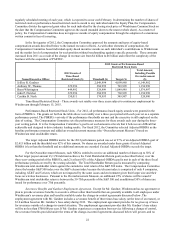
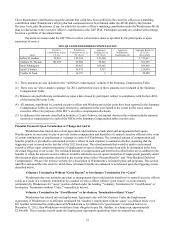
other is predominately made up of healthy rewards program incentives and cell phone allowances, in each case for and
on behalf of the named officers as follows:
Name Year
Company
Contributions
to Plans
Imputed Life
Insurance,
Aircraft Use, and
Other Total
Jeffery R. Gardner 2012 114,334 2,773 117,107
2011 129,334 3,413 132,747
2010 103,763 2,345 106,108
Anthony W. Thomas 2012 39,443 14,151 53,594
2011 39,608 3,688 43,296
2010 24,440 2,706 27,146
Brent Whittington 2012 52,892 21,987 74,879
2011 59,263 22,571 81,834
2010 68,849 7,805 76,654
John P. Fletcher 2012 41,175 18,436 59,611
2011 44,272 9,857 54,129
2010 28,141 2,360 30,501
Cynthia B. Nash 2012 26,633 316 26,949
2011 26,559 428 26,987
2010 14,751 1,612 16,363
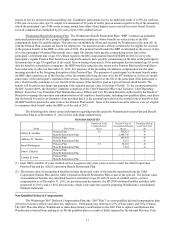
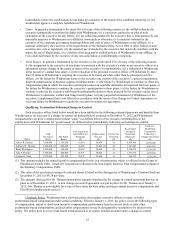
Information On Plan-Based Awards
The following table shows information regarding grants of plan-based awards, including equity and non-equity incentive
plans, made by Windstream during 2012 to the individuals named below. All equity grants made in 2012 were made
pursuant to the Amended and Restated 2006 Equity Incentive Plan. All non-equity grants made in 2012 were made pursuant
to Windstream’s short-term cash incentive plans described in the CD&A.
GRANTS OF PLAN-BASED AWARDS
Name
Grant
Date
Estimated Future Payouts Under
Non-Equity Incentive Plan Award
Estimated Future Payouts Under Equity
Incentive Plan Awards All Other Stock
Awards: Number
of Shares of Stock
or Units
(#) (6)
Grant Date Fair
Value of Stock
and Option
Awards
($)
(8)
Threshold
($)
Target
($)
Maximum
($)
Threshold
(#)
Target
(#)
Maximum
(#)
Jeffery R. Gardner 2/7/12
2/7/12
2/7/12
675,000 1,350,000 2,700,000 54,931(1)
45,558(2)
109,861(1)
91,116 (2)
116,504(3)
164,792(4)
136,674(5)
-0-
2,050,006
1,700,225
1,449,322
Anthony W.
Thomas
2/7/12
2/7/12
2/7/12
200,000 400,000 800,000 10,317(1)
5,062 (2)
20,633 (1)
10,124 (2)
8,090 (3)
30,950 (4)
15,186 (5)
26,527 (7)
385,012
188,913
100,640
329,996
Brent Whittington 2/7/12
2/7/12
2/7/12
254,000 580,000 1,016,000 14,068(1)
6,327 (2)
28,135 (1)
12,655 (2)
14,563 (3)
42,203 (4)
18,982 (5)
36,173 (7)
524,999
236,142
181,164
449,992
John P. Fletcher 2/7/12
2/7/12
2/7/12
200,000 400,000 800,000 10,317(1)
5,062 (2)
20,633(1)
10,124 (2)
10,517(3)
30,950(4)
15,186 (5)
26,527 (7)
385,012
188,914
130,831
329,996
Cynthia B. Nash 2/7/12
2/7/12
2/7/12
131,250 262,500 525,000 4,689 (1)
2,531 (2)
9,378 (1)
5,062 (2)
5,177 (3)
14,067(4)
7,593 (5)
12,058 (7)
174,993
94,457
64,402
150,002
(1) These amounts represent one-third (1/3) of the threshold and target amounts of an award of performance-based restricted
stock units (or PBRSUs) granted to the named executive officer in 2012 that vest ratably over a three-year period with
each year set as a separate performance period. The Compensation Committee sets the threshold and target Adjusted
OIBDA amount each year during the three-year vesting period. Pursuant to SEC rules and applicable accounting rules,
because the Compensation Committee sets the annual performance targets at the start of each respective performance
period, only the grant date fair value of the portion of the grant subject to a particular performance period is reported in
this table, which results in a disparity between the annual grant values approved by the Compensation Committee and the
amounts reported above.
27