Windstream 2012 Annual Report Download - page 110
Download and view the complete annual report
Please find page 110 of the 2012 Windstream annual report below. You can navigate through the pages in the report by either clicking on the pages listed below, or by using the keyword search tool below to find specific information within the annual report.-
 1
1 -
2
-
3
-
4
-
5
-
6
-
7
-
8
-
9
-
10
-
11
-
12
-
13
-
14
-
15
-
16
-
17
-
18
-
19
-
20
-
21
-
22
-
23
-
24
-
25
-
26
-
27
-
28
-
29
-
30
-
31
-
32
-
33
-
34
-
35
-
36
-
37
-
38
-
39
-
40
-
41
-
42
-
43
-
44
-
45
-
46
-
47
-
48
-
49
-
50
-
51
-
52
-
53
-
54
-
55
-
56
-
57
-
58
-
59
-
60
-
61
-
62
-
63
-
64
-
65
-
66
-
67
-
68
-
69
-
70
-
71
-
72
-
73
-
74
-
75
-
76
-
77
-
78
-
79
-
80
-
81
-
82
-
83
-
84
-
85
-
86
-
87
-
88
-
89
-
90
-
91
-
92
-
93
-
94
-
95
-
96
-
97
-
98
-
99
-
 100
100 -
 101
101 -
 102
102 -
 103
103 -
 104
104 -
 105
105 -
 106
106 -
 107
107 -
 108
108 -
 109
109 -
 110
110 -
 111
111 -
 112
112 -
 113
113 -
 114
114 -
 115
115 -
 116
116 -
 117
117 -
 118
118 -
 119
119 -
 120
120 -
121
-
122
-
123
-
124
-
125
-
126
-
127
-
128
-
129
-
130
-
131
-
132
-
133
-
134
-
135
-
136
-
137
-
138
-
139
-
140
-
141
-
142
-
143
-
144
-
145
-
146
-
147
-
148
-
149
-
150
-
151
-
152
-
153
-
154
-
155
-
156
-
157
-
158
-
159
-
160
-
161
-
162
-
163
-
164
-
165
-
166
-
167
-
168
-
169
-
170
-
171
-
172
-
173
-
174
-
175
-
176
-
177
-
178
-
179
-
180
-
181
-
182
-
183
-
184
-
185
-
186
-
187
-
188
-
189
-
190
-
191
-
192
-
193
-
194
-
195
-
196
 |
 |

F-12
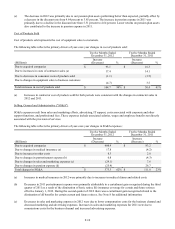
Set forth below is a summary of restructuring and merger and integration costs for the years ended December 31:
(Millions) 2012 2011 2010
Merger and integration costs
Transaction costs associated with acquisitions (a) $ 7.1 $ 40.7 $ 41.2
Employee related transition costs (b) 20.3 22.3 26.7
Information technology conversion costs 6.1 5.7 4.2
Rebranding, consulting and other costs (c) 31.9 1.1 5.2
Total merger and integration costs 65.4 69.8 77.3
Restructuring charges 27.4 1.3 7.7
Total merger, integration and restructuring charges $ 92.8 $ 71.1 $ 85.0
(a) Transaction costs in 2012, 2011 and 2010 primarily relate to accounting, legal and broker fees and other miscellaneous
costs associated with the acquisitions of the Acquired Companies, respectively. These costs are considered indirect or
general and are expensed when incurred.
(b) Employee related transition costs primarily consists of severance related to the integration of the Acquired Companies.
(c) Increases are primarily due to the nationwide rebranding of the PAETEC markets and consulting fees related to
integration activities.
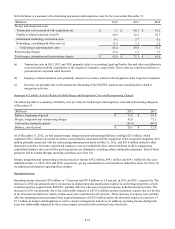
Summary of Liability Activity Related to Both Merger and Integration Costs and Restructuring Charges
The following table is a summary of liability activity related to both merger and integration costs and restructuring charges as
of December 31:
(Millions) 2012 2011
Balance, beginning of period $ 12.9 $ 10.5
Merger, integration and restructuring charges 92.8 71.1
Cash outlays during the period (85.4)(68.7)
Balance, end of period $ 20.3 $ 12.9
As of December 31, 2012, we had unpaid merger, integration and restructuring liabilities totaling $20.3 million, which
consisted of $3.7 million of accrued severance costs primarily associated with the integration of the Acquired Companies, $5.8
million primarily associated with the restructuring announcement made on May 31, 2012, and $10.8 million related to other
integration activities. Severance and related employee costs are included in other current liabilities in the accompanying
consolidated balance sheet and will be paid as positions are eliminated, excluding salary continuation payments. Each of these
payments will be funded through operating cash flows (see Note 10).
Merger, integration and restructuring costs decreased net income $58.2 million, $44.1 million and $59.1 million for the years
ended December 31, 2012, 2011 and 2010, respectively, giving consideration to tax benefits on deductible items. See Note 10
for additional information regarding these charges.
Operating Income
Operating income decreased $76 million, or 7.9 percent and $70.0 million, or 6.8 percent, in 2012 and 2011, respectively. The
decrease in 2012 was primarily due to an increase in depreciation and amortization expense in our heritage properties, which
exclude properties acquired from PAETEC, partially offset by a decrease in pension expense, both discussed previously. The
decrease in 2011 was primarily due to the unfavorable impacts of a $113.2 million increase in pension expense due to a decline
in the discount rate and lower returns on plan assets also contributed to the increase. These increases in expense were partially
offset by operating income generated from acquired businesses of $54.3 million and by the favorable impact of a decrease of
$7.5 million in merger and integration as well as expense management initiatives. In addition, operating income during both
years was unfavorably impacted by the revenue impact associated with continued voice line losses.