Windstream 2012 Annual Report Download - page 106
Download and view the complete annual report
Please find page 106 of the 2012 Windstream annual report below. You can navigate through the pages in the report by either clicking on the pages listed below, or by using the keyword search tool below to find specific information within the annual report.-
 1
1 -
2
-
3
-
4
-
5
-
6
-
7
-
8
-
9
-
10
-
11
-
12
-
13
-
14
-
15
-
16
-
17
-
18
-
19
-
20
-
21
-
22
-
23
-
24
-
25
-
26
-
27
-
28
-
29
-
30
-
31
-
32
-
33
-
34
-
35
-
36
-
37
-
38
-
39
-
40
-
41
-
42
-
43
-
44
-
45
-
46
-
47
-
48
-
49
-
50
-
51
-
52
-
53
-
54
-
55
-
56
-
57
-
58
-
59
-
60
-
61
-
62
-
63
-
64
-
65
-
66
-
67
-
68
-
69
-
70
-
71
-
72
-
73
-
74
-
75
-
76
-
77
-
78
-
79
-
80
-
81
-
82
-
83
-
84
-
85
-
86
-
87
-
88
-
89
-
90
-
91
-
92
-
93
-
94
-
95
-
 96
96 -
 97
97 -
 98
98 -
 99
99 -
 100
100 -
 101
101 -
 102
102 -
 103
103 -
 104
104 -
 105
105 -
 106
106 -
 107
107 -
 108
108 -
 109
109 -
 110
110 -
 111
111 -
 112
112 -
 113
113 -
 114
114 -
 115
115 -
 116
116 -
117
-
118
-
119
-
120
-
121
-
122
-
123
-
124
-
125
-
126
-
127
-
128
-
129
-
130
-
131
-
132
-
133
-
134
-
135
-
136
-
137
-
138
-
139
-
140
-
141
-
142
-
143
-
144
-
145
-
146
-
147
-
148
-
149
-
150
-
151
-
152
-
153
-
154
-
155
-
156
-
157
-
158
-
159
-
160
-
161
-
162
-
163
-
164
-
165
-
166
-
167
-
168
-
169
-
170
-
171
-
172
-
173
-
174
-
175
-
176
-
177
-
178
-
179
-
180
-
181
-
182
-
183
-
184
-
185
-
186
-
187
-
188
-
189
-
190
-
191
-
192
-
193
-
194
-
195
-
196
 |
 |

F-8
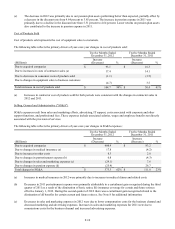
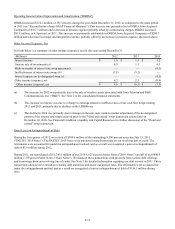
Revenues from these services are expected to decline due to voice line losses and reductions in switched access rates.
The following table reflects the primary drivers of year-over-year changes in wholesale service revenues:
Twelve Months Ended
December 31, 2012
Twelve Months Ended
December 31, 2011
(Millions)
Increase
(Decrease) %
Increase
(Decrease) %
Due to acquired companies $ 234.1 $ 43.6
Due to changes in federal USF revenues (a) 22.5 (6.2)
Due to decreases in voice and other revenues (0.4)(1.1)
Due to decreases in state USF revenues (b) (2.7)(7.3)
Due to decreases in switched access revenues (c) (92.8) (37.6)
Total changes in wholesale revenues $ 160.7 29% $ (8.6)(2)%
(a) Increases in federal USF revenues were primarily due to the implementation of the access recovery mechanism
("ARM") during the third quarter of 2012. The ARM is additional federal universal service support available to help
mitigate revenue losses from intercarrier compensation reform not covered by the ARC, previously discussed.
Decreases in federal USF revenues in 2011 resulted from decreases in federal funds received and line loss.
(b) Decreases in state USF revenues were attributable to the decline in voice lines and changes in eligible recoverable
costs.
(c) Decreases in switched access revenues in 2012 were primarily due to the impact of intercarrier compensation reform
and continued declines in voice lines. The ARC and ARM, discussed previously, are designed to help mitigate the
revenue losses resulting from intercarrier compensation reform. Decreases in 2011 were primarily due to continued
declines in voice lines and the phased reduction on interstate access rates for our subsidiaries that converted to price
cap regulation.
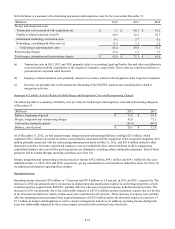
Other Service Revenues
Other service revenues include USF surcharge revenues, revenues from software, other miscellaneous services and consumer
revenues generated in markets where we lease the connection to the customer premise, and we no longer offer new consumer
service in those areas. As a result, we expect other service revenues to decline as existing customers disconnect.
The following table reflects the primary drivers of year-over-year changes in other service revenues:
Twelve Months Ended
December 31, 2012
Twelve Months Ended
December 31, 2011
(Millions)
Increase
(Decrease) %
Increase
(Decrease) %
Due to acquired companies $ 142.3 $ 25.2
Due to increases in pass through taxes and other surcharges 4.5 1.7
Due to decreases in other (11.6) (11.1)
Total changes in other revenues $ 135.2 103% $ 15.8 14%
Product Sales
Product sales consist of sales of various types of communications equipment to our customers. Business product sales includes
high-end data and communications equipment which facilitate the delivery of advanced data and voice services to our business
customers. Consumer product sales include high-speed Internet modems, home networking equipment, computers and phones.
We also sell network equipment to contractors on a wholesale basis.