Windstream 2012 Annual Report Download - page 105
Download and view the complete annual report
Please find page 105 of the 2012 Windstream annual report below. You can navigate through the pages in the report by either clicking on the pages listed below, or by using the keyword search tool below to find specific information within the annual report.-
 1
1 -
2
-
3
-
4
-
5
-
6
-
7
-
8
-
9
-
10
-
11
-
12
-
13
-
14
-
15
-
16
-
17
-
18
-
19
-
20
-
21
-
22
-
23
-
24
-
25
-
26
-
27
-
28
-
29
-
30
-
31
-
32
-
33
-
34
-
35
-
36
-
37
-
38
-
39
-
40
-
41
-
42
-
43
-
44
-
45
-
46
-
47
-
48
-
49
-
50
-
51
-
52
-
53
-
54
-
55
-
56
-
57
-
58
-
59
-
60
-
61
-
62
-
63
-
64
-
65
-
66
-
67
-
68
-
69
-
70
-
71
-
72
-
73
-
74
-
75
-
76
-
77
-
78
-
79
-
80
-
81
-
82
-
83
-
84
-
85
-
86
-
87
-
88
-
89
-
90
-
91
-
92
-
93
-
94
-
 95
95 -
 96
96 -
 97
97 -
 98
98 -
 99
99 -
 100
100 -
 101
101 -
 102
102 -
 103
103 -
 104
104 -
 105
105 -
 106
106 -
 107
107 -
 108
108 -
 109
109 -
 110
110 -
 111
111 -
 112
112 -
 113
113 -
 114
114 -
 115
115 -
116
-
117
-
118
-
119
-
120
-
121
-
122
-
123
-
124
-
125
-
126
-
127
-
128
-
129
-
130
-
131
-
132
-
133
-
134
-
135
-
136
-
137
-
138
-
139
-
140
-
141
-
142
-
143
-
144
-
145
-
146
-
147
-
148
-
149
-
150
-
151
-
152
-
153
-
154
-
155
-
156
-
157
-
158
-
159
-
160
-
161
-
162
-
163
-
164
-
165
-
166
-
167
-
168
-
169
-
170
-
171
-
172
-
173
-
174
-
175
-
176
-
177
-
178
-
179
-
180
-
181
-
182
-
183
-
184
-
185
-
186
-
187
-
188
-
189
-
190
-
191
-
192
-
193
-
194
-
195
-
196
 |
 |

F-7
(d) Decreases in traditional voice service revenues were primarily attributable to competition and migration of existing
customers to integrated services and bundled offerings. These declines were partially offset by $8.9 million due to the
implementation of the access recovery charge ("ARC"), which is a monthly charge established by the FCC designed to
mitigate revenue reductions resulting from intercarrier compensation reform implemented in the third quarter of 2012.
Consumer Service Revenues
Consumer service revenues are generated from the provision of high-speed Internet, voice and video services to consumers. We
expect the trend of consumer voice line loss to continue as a result of competition from wireless carriers, cable television
companies and other providers using emerging technologies. For the twelve months ended December 31, 2012, consumer voice
lines decreased by approximately 86,000, or 4.5 percent. Increasing revenues from high-speed Internet and related services
helped offset some of the losses in consumer voice revenues. Demand for faster broadband speeds and Internet-related services,
such as virus protection and online data backup services, are expected to favorably impact consumer high-speed Internet
revenues, offsetting some of the decline in consumer voice revenues.
For the twelve months ended December 31, 2012, consumer high-speed Internet customers increased by approximately 7,000
or 0.6 percent. As of December 31, 2012, we provided high-speed Internet service to approximately 42 percent of total voice
lines in service and approximately 71 percent of primary residential lines in service. As of December 31, 2012, approximately
77 percent of our total voice lines had high-speed Internet competition, primarily from cable service providers. We do not
expect significant additional cable expansions into our service areas during 2013, but we could experience some increased
competition from high-speed Internet offerings of wireless competitors. We expect the pace of high-speed Internet customer
growth to slow as the number of households without high-speed Internet service shrinks and our penetration continues to
increase.
To combat competitive pressures in our markets, we emphasize our bundled service strategy and enhancements to our network
to offer faster Internet speeds. Service bundles provide discounts and other incentives for customers to bundle their voice, long
distance, high-speed Internet and video services and have positively impacted our operating trends.
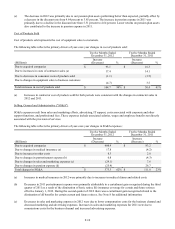
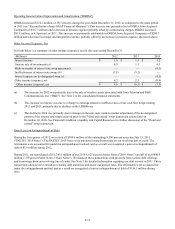
The following table reflects the primary drivers of year-over-year changes in consumer service revenues:
Twelve Months Ended
December 31, 2012
Twelve Months Ended
December 31, 2011
(Millions)
Increase
(Decrease) %
Increase
(Decrease) %
Due to acquired companies $ — $ 43.1
Due to increases in high-speed Internet revenues (a) 17.9 36.3
Due to changes in miscellaneous revenues (4.7) 1.8
Due to decreases in voice and long distance revenues (b) (52.0) (75.7)
Total changes in consumer revenues $(38.8) (3)% $ 5.5 —%
(a) Increases in high-speed Internet revenues were primarily due to the increase in high-speed Internet customers, continued
migration to higher speeds and increased sales of value added services, as previously discussed.
(b) Decreases in voice service revenues were primarily attributable to declines in voice lines. These declines were partially
offset by $4.8 million due to the implementation of the ARC, described above.
Wholesale Service Revenues
Wholesale service revenues include switched access revenues, Universal Service Fund ("USF") revenues and voice and data
services sold on a wholesale basis.
Switched access revenues include usage sensitive revenues from long distance companies and other carriers for access to our
network in connection with the completion of long distance calls, as well as reciprocal compensation received from wireless
and other local connecting carriers for the use of our facilities. USF revenues are government subsidies designed to partially
offset the cost of providing wireline services in high-cost areas. In addition, we offer our voice and data services on a wholesale
basis to other carriers.