Windstream 2012 Annual Report Download - page 109
Download and view the complete annual report
Please find page 109 of the 2012 Windstream annual report below. You can navigate through the pages in the report by either clicking on the pages listed below, or by using the keyword search tool below to find specific information within the annual report.-
 1
1 -
2
-
3
-
4
-
5
-
6
-
7
-
8
-
9
-
10
-
11
-
12
-
13
-
14
-
15
-
16
-
17
-
18
-
19
-
20
-
21
-
22
-
23
-
24
-
25
-
26
-
27
-
28
-
29
-
30
-
31
-
32
-
33
-
34
-
35
-
36
-
37
-
38
-
39
-
40
-
41
-
42
-
43
-
44
-
45
-
46
-
47
-
48
-
49
-
50
-
51
-
52
-
53
-
54
-
55
-
56
-
57
-
58
-
59
-
60
-
61
-
62
-
63
-
64
-
65
-
66
-
67
-
68
-
69
-
70
-
71
-
72
-
73
-
74
-
75
-
76
-
77
-
78
-
79
-
80
-
81
-
82
-
83
-
84
-
85
-
86
-
87
-
88
-
89
-
90
-
91
-
92
-
93
-
94
-
95
-
96
-
97
-
98
-
 99
99 -
 100
100 -
 101
101 -
 102
102 -
 103
103 -
 104
104 -
 105
105 -
 106
106 -
 107
107 -
 108
108 -
 109
109 -
 110
110 -
 111
111 -
 112
112 -
 113
113 -
 114
114 -
 115
115 -
 116
116 -
 117
117 -
 118
118 -
 119
119 -
120
-
121
-
122
-
123
-
124
-
125
-
126
-
127
-
128
-
129
-
130
-
131
-
132
-
133
-
134
-
135
-
136
-
137
-
138
-
139
-
140
-
141
-
142
-
143
-
144
-
145
-
146
-
147
-
148
-
149
-
150
-
151
-
152
-
153
-
154
-
155
-
156
-
157
-
158
-
159
-
160
-
161
-
162
-
163
-
164
-
165
-
166
-
167
-
168
-
169
-
170
-
171
-
172
-
173
-
174
-
175
-
176
-
177
-
178
-
179
-
180
-
181
-
182
-
183
-
184
-
185
-
186
-
187
-
188
-
189
-
190
-
191
-
192
-
193
-
194
-
195
-
196
 |
 |
F-11
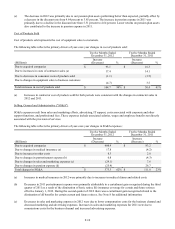
(d) The decrease in 2012 was primarily due to our pension plan assets performing better than expected, partially offset by
a decrease in the discount rate from 4.64 percent to 3.85 percent. The increase in pension expense in 2011 was
primarily due to a decline in the discount rate from 5.31 percent to 4.64 percent and lower returns on pension plan
assets than expected.
Depreciation and Amortization Expense
Depreciation and amortization expense primarily includes the depreciation of our plant assets and the amortization of our
intangible assets.
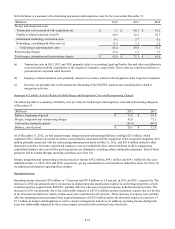
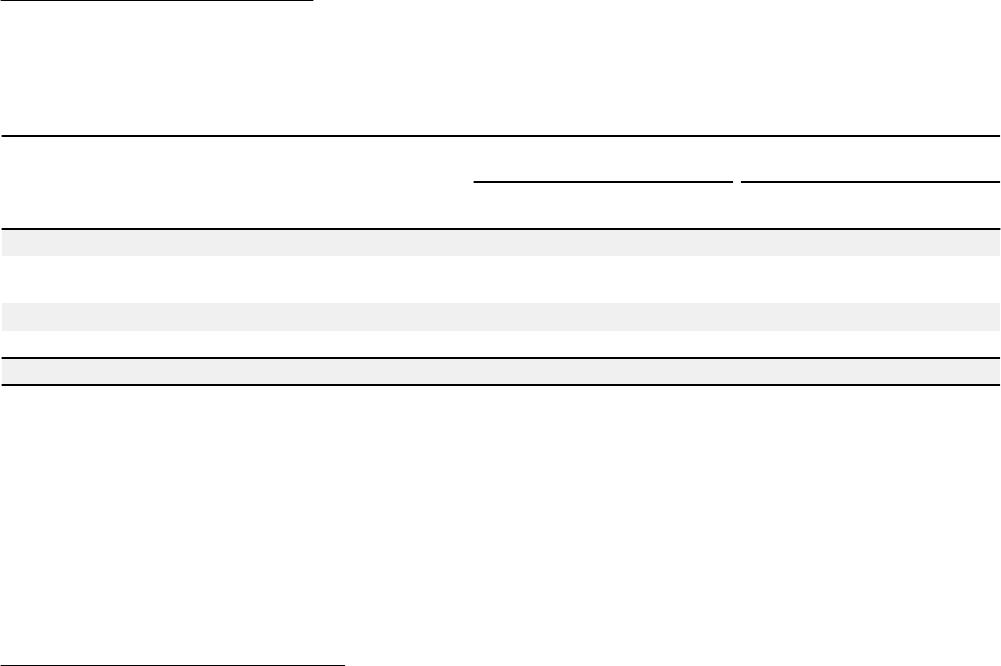
The following table reflects the primary drivers of year-over-year changes in depreciation and amortization expense:
Twelve Months Ended
December 31, 2012
Twelve Months Ended
December 31, 2011
(Millions)
Increase
(Decrease) %
Increase
(Decrease) %
Due to depreciation of acquired businesses fixed assets $ 184.4 $ 58.5
Due to amortization of intangible assets acquired in the
purchase of acquired companies 149.7 87.6
Due to increases in depreciation expense (a) 144.4 28.6
Due to decreases in amortization expense (b) (28.4) (20.9)
Total changes in depreciation and amortization expense $ 450.1 53% $ 153.8 22%
(a) Increases in depreciation expense were primarily due to additions in property, plant and equipment in 2012.
Additionally, we implemented new depreciation rates beginning in 2012 for certain subsidiaries, which resulted in a
net increase to depreciation expense of $59.1 million for the year ended December 31, 2012. See Note 2 to the
consolidated financial statements. Increases in depreciation expense in 2011 were primarily due to additions in
property, plant and equipment.
(b) Decreases in amortization expense were due to the use of accelerated amortization methods primarily due to the use of
sum of the years digits method used for customer lists, which result in declines in expense each year as intangible
assets amortize.
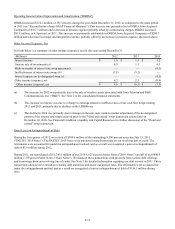
Merger, Integration and Restructuring Costs
We incur a significant amount of costs to complete a merger or acquisition and integrate its operations into our business, which
are presented as merger and integration expense in our results of operations. These costs include transaction costs, such as
accounting, legal and broker fees; severance and related costs; IT and network conversion; rebranding; and consulting fees. Our
recent acquisitions of PAETEC, NuVox, Iowa Telecom, Q-Comm, and Hosted Solutions described in the section "Strategic
Transactions" drive merger and integration costs for the years presented.
Restructuring charges are sometimes incurred as a result of evaluations of our operating structure. Among other things, these
evaluations explore opportunities for task automation, network efficiency and the balancing of our workforce based on the
current needs of our customers. Severance, lease exit costs and other related charges are included in restructuring charges.
On May 31, 2012, we announced the review of our management structure to increase the efficiency of decision-making, to
ensure our management structure is as simple and as responsive to customers as possible and position ourselves for continued
success. We eliminated approximately 350 management positions as part of the restructuring, which was completed in the third
quarter of 2012 and resulted in severance related costs of $22.4 million. The changes will result in annualized savings of
approximately $40.0 million. Merger, integration and restructuring costs are unpredictable by nature but should not necessarily
be viewed as non-recurring.