DTE Energy 2014 Annual Report Download - page 103
Download and view the complete annual report
Please find page 103 of the 2014 DTE Energy annual report below. You can navigate through the pages in the report by either clicking on the pages listed below, or by using the keyword search tool below to find specific information within the annual report.-
 1
1 -
2
-
3
-
4
-
5
-
6
-
7
-
8
-
9
-
10
-
11
-
12
-
13
-
14
-
15
-
16
-
17
-
18
-
19
-
20
-
21
-
22
-
23
-
24
-
25
-
26
-
27
-
28
-
29
-
30
-
31
-
32
-
33
-
34
-
35
-
36
-
37
-
38
-
39
-
40
-
41
-
42
-
43
-
44
-
45
-
46
-
47
-
48
-
49
-
50
-
51
-
52
-
53
-
54
-
55
-
56
-
57
-
58
-
59
-
60
-
61
-
62
-
63
-
64
-
65
-
66
-
67
-
68
-
69
-
70
-
71
-
72
-
73
-
74
-
75
-
76
-
77
-
78
-
79
-
80
-
81
-
82
-
83
-
84
-
85
-
86
-
87
-
88
-
89
-
90
-
91
-
92
-
 93
93 -
 94
94 -
 95
95 -
 96
96 -
 97
97 -
 98
98 -
 99
99 -
 100
100 -
 101
101 -
 102
102 -
 103
103 -
 104
104 -
 105
105 -
 106
106 -
 107
107 -
 108
108 -
 109
109 -
 110
110 -
 111
111 -
 112
112 -
 113
113 -
114
-
115
-
116
-
117
-
118
-
119
-
120
-
121
-
122
-
123
-
124
-
125
-
126
-
127
-
128
-
129
-
130
-
131
-
132
-
133
-
134
-
135
-
136
-
137
-
138
-
139
-
140
-
141
-
142
-
143
-
144
-
145
-
146
-
147
-
148
-
149
-
150
-
151
-
152
-
153
-
154
-
155
-
156
-
157
-
158
-
159
-
160
-
161
-
162
-
163
-
164
-
165
-
166
-
167
-
168
-
169
-
170
-
171
-
172
-
173
-
174
-
175
-
176
-
177
-
178
-
179
-
180
-
181
-
182
-
183
-
184
-
185
-
186
-
187
-
188
-
189
-
190
 |
 |

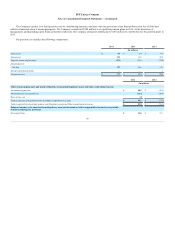
Assumptions used in determining the accumulated postretirement benefit obligation and net other postretirement benefit costs are listed below:
Discount rate
4.95%
4.15%
Health care trend rate pre- and post- 65
7.50 / 6.50%
7.00%
Ultimate health care trend rate
4.50%
5.00%
Year in which ultimate reached pre- and post- 65
2025 / 2024
2021
Discount rate (prior to interim remeasurement)
4.15%
5.00%
Discount rate (post interim remeasurement)
4.30%
N/A
Expected long-term rate of return on plan assets
8.25%
8.25%
Health care trend rate pre- and post- 65
7.00%
7.00%
Ultimate health care trend rate
5.00%
5.00%
Year in which ultimate reached pre- and post- 65
2021
2020
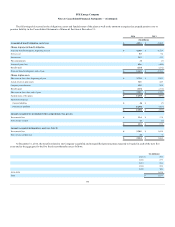
A one percentage point increase in health care cost trend rates would have increased the total service cost and interest cost components of benefit costs
by $8 million in 2014 and increased the accumulated benefit obligation by $108 million at December 31, 2014. A one percentage point decrease in the
health care cost trend rates would have decreased the total service and interest cost components of benefit costs by $7 million in 2014 and would have
decreased the accumulated benefit obligation by $94 million at December 31, 2014.
The process used in determining the long-term rate of return for assets and the investment approach for the Company’s other postretirement benefits
plans is similar to those previously described for its pension plans.
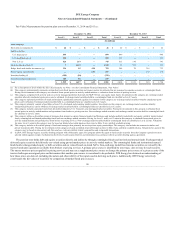
Target allocations for other postretirement benefit plan assets as of December 31, 2014 are listed below:
U.S. Large Cap Equity Securities
U.S. Small Cap and Mid Cap Equity Securities
Non U.S. Equity Securities
Fixed Income Securities
Hedge Funds and Similar Investments
Private Equity and Other
100