DTE Energy 2014 Annual Report Download - page 44
Download and view the complete annual report
Please find page 44 of the 2014 DTE Energy annual report below. You can navigate through the pages in the report by either clicking on the pages listed below, or by using the keyword search tool below to find specific information within the annual report.-
 1
1 -
2
-
3
-
4
-
5
-
6
-
7
-
8
-
9
-
10
-
11
-
12
-
13
-
14
-
15
-
16
-
17
-
18
-
19
-
20
-
21
-
22
-
23
-
24
-
25
-
26
-
27
-
28
-
29
-
30
-
31
-
32
-
33
-
 34
34 -
 35
35 -
 36
36 -
 37
37 -
 38
38 -
 39
39 -
 40
40 -
 41
41 -
 42
42 -
 43
43 -
 44
44 -
 45
45 -
 46
46 -
 47
47 -
 48
48 -
 49
49 -
 50
50 -
 51
51 -
 52
52 -
 53
53 -
 54
54 -
55
-
56
-
57
-
58
-
59
-
60
-
61
-
62
-
63
-
64
-
65
-
66
-
67
-
68
-
69
-
70
-
71
-
72
-
73
-
74
-
75
-
76
-
77
-
78
-
79
-
80
-
81
-
82
-
83
-
84
-
85
-
86
-
87
-
88
-
89
-
90
-
91
-
92
-
93
-
94
-
95
-
96
-
97
-
98
-
99
-
100
-
101
-
102
-
103
-
104
-
105
-
106
-
107
-
108
-
109
-
110
-
111
-
112
-
113
-
114
-
115
-
116
-
117
-
118
-
119
-
120
-
121
-
122
-
123
-
124
-
125
-
126
-
127
-
128
-
129
-
130
-
131
-
132
-
133
-
134
-
135
-
136
-
137
-
138
-
139
-
140
-
141
-
142
-
143
-
144
-
145
-
146
-
147
-
148
-
149
-
150
-
151
-
152
-
153
-
154
-
155
-
156
-
157
-
158
-
159
-
160
-
161
-
162
-
163
-
164
-
165
-
166
-
167
-
168
-
169
-
170
-
171
-
172
-
173
-
174
-
175
-
176
-
177
-
178
-
179
-
180
-
181
-
182
-
183
-
184
-
185
-
186
-
187
-
188
-
189
-
190
 |
 |

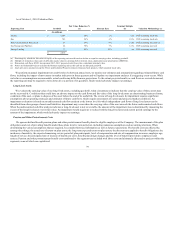
Derivatives are generally recorded at fair value and shown as Derivative Assets or Liabilities. Contracts we typically classify as derivative instruments
include power, natural gas, oil and certain coal forwards, futures, options and swaps, and foreign currency exchange contracts. Items we do not generally
account for as derivatives include natural gas inventory, pipeline transportation contracts, renewable energy credits and storage assets. See Notes 11 and 12
to the Consolidated Financial Statements in Item 8 of this Report, "Fair Value" and "Financial and Other Derivative Instruments".
The tables below do not include the expected earnings impact of non-derivative natural gas storage, transportation, certain power contracts and
renewable energy credits which are subject to accrual accounting. Consequently, gains and losses from these positions may not match with the related
physical and financial hedging instruments in some reporting periods, resulting in volatility in DTE Energy’s reported period-by-period earnings; however,
the financial impact of the timing differences will reverse at the time of physical delivery and/or settlement.
The Company manages its MTM risk on a portfolio basis based upon the delivery period of its contracts and the individual components of the risks
within each contract. Accordingly, the Company records and manages the energy purchase and sale obligations under its contracts in separate components
based on the commodity (e.g. electricity or natural gas), the product (e.g. electricity for delivery during peak or off-peak hours), the delivery location (e.g. by
region), the risk profile (e.g. forward or option), and the delivery period (e.g. by month and year).
The Company has established a fair value hierarchy that prioritizes the inputs to valuation techniques used to measure fair value in three broad levels.
The fair value hierarchy gives the highest priority to quoted prices (unadjusted) in active markets for identical assets or liabilities (Level 1) and the lowest
priority to unobservable inputs (Level 3). For further discussion of the fair value hierarchy, see Note 11 to the Consolidated Financial Statements in Item 8 of
this Report, "Fair Value".
The following tables provide details on changes in our MTM net asset (or liability) position during 2014:
MTM at December 31, 2013 $ (112)
Reclassify to realized upon settlement 94
Changes in fair value recorded to income 79
Amounts recorded to unrealized income 173
Changes in fair value recorded in regulatory liabilities 8
Change in collateral held by (for) others 28
Option premiums received and other (10)
MTM at December 31, 2014 $ 87
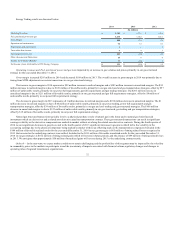
The table below shows the maturity of our MTM positions. The positions from 2018 and beyond principally represent longer tenor gas structured
transactions:
Level 1
$ (3)
$ (7)
$ (3)
$ —
$ (13)
Level 2
48
4
5
—
57
Level 3
(3)
6
—
21
24
MTM before collateral adjustments
$ 42
$ 3
$ 2
$ 21
68
Collateral adjustments
19
MTM at December 31, 2014
$ 87
42