DTE Energy 2014 Annual Report Download - page 37
Download and view the complete annual report
Please find page 37 of the 2014 DTE Energy annual report below. You can navigate through the pages in the report by either clicking on the pages listed below, or by using the keyword search tool below to find specific information within the annual report.-
 1
1 -
2
-
3
-
4
-
5
-
6
-
7
-
8
-
9
-
10
-
11
-
12
-
13
-
14
-
15
-
16
-
17
-
18
-
19
-
20
-
21
-
22
-
23
-
24
-
25
-
26
-
 27
27 -
 28
28 -
 29
29 -
 30
30 -
 31
31 -
 32
32 -
 33
33 -
 34
34 -
 35
35 -
 36
36 -
 37
37 -
 38
38 -
 39
39 -
 40
40 -
 41
41 -
 42
42 -
 43
43 -
 44
44 -
 45
45 -
 46
46 -
 47
47 -
48
-
49
-
50
-
51
-
52
-
53
-
54
-
55
-
56
-
57
-
58
-
59
-
60
-
61
-
62
-
63
-
64
-
65
-
66
-
67
-
68
-
69
-
70
-
71
-
72
-
73
-
74
-
75
-
76
-
77
-
78
-
79
-
80
-
81
-
82
-
83
-
84
-
85
-
86
-
87
-
88
-
89
-
90
-
91
-
92
-
93
-
94
-
95
-
96
-
97
-
98
-
99
-
100
-
101
-
102
-
103
-
104
-
105
-
106
-
107
-
108
-
109
-
110
-
111
-
112
-
113
-
114
-
115
-
116
-
117
-
118
-
119
-
120
-
121
-
122
-
123
-
124
-
125
-
126
-
127
-
128
-
129
-
130
-
131
-
132
-
133
-
134
-
135
-
136
-
137
-
138
-
139
-
140
-
141
-
142
-
143
-
144
-
145
-
146
-
147
-
148
-
149
-
150
-
151
-
152
-
153
-
154
-
155
-
156
-
157
-
158
-
159
-
160
-
161
-
162
-
163
-
164
-
165
-
166
-
167
-
168
-
169
-
170
-
171
-
172
-
173
-
174
-
175
-
176
-
177
-
178
-
179
-
180
-
181
-
182
-
183
-
184
-
185
-
186
-
187
-
188
-
189
-
190
 |
 |

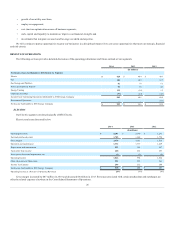
Cash inflows associated with investing activities are primarily generated from the sale of assets, while cash outflows are the result of plant and
equipment expenditures. In any given year, we will look to realize cash from under-performing or non-strategic assets or matured fully valued assets.
Capital spending within the utility business is primarily to maintain and improve our electric generation and electric and natural gas distribution
infrastructure and to comply with environmental regulations and renewable energy requirements.
Capital spending within our non-utility businesses is primarily for ongoing maintenance, expansion and growth. We look to make growth investments
that meet strict criteria in terms of strategy, management skills, risks and returns. All new investments are analyzed for their rates of return and cash payback
on a risk adjusted basis. We have been disciplined in how we deploy capital and will not make investments unless they meet our criteria. For new business
lines, we initially invest based on research and analysis. We start with a limited investment, we evaluate results and either expand or exit the business based
on those results. In any given year, the amount of growth capital will be determined by the underlying cash flows of the Company with a clear understanding
of any potential impact on our credit ratings.
Net cash used for investing activities increased $154 million in 2014 due primarily to increased capital expenditures by our utility businesses, partially
offset by decreased capital expenditures by our non-utility business and increased proceeds from sale of assets.
Net cash used for investing activities increased $137 million in 2013 due primarily to increased capital expenditures by our utility businesses.
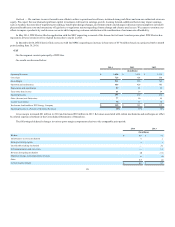
We rely on both short-term borrowing and long-term financing as a source of funding for our capital requirements not satisfied by our operations.
Our strategy is to have a targeted debt portfolio blend of fixed and variable interest rates and maturity. We continually evaluate our leverage target,
which is currently 50% to 53%, to ensure it is consistent with our objective to have a strong investment grade debt rating.
Net cash from financing activities increased $478 million in 2014. The increase was primarily attributable to increases in short-term borrowings and
issuances of long-term debt, partially offset by increased redemptions of long-term debt, repurchases of common stock and increased dividends on common
stock.
Net cash used for financing activities decreased $182 million in 2013. The decrease was primarily attributable to higher issuances of long-term debt,
partially offset by higher redemptions of long-term debt.
We expect cash flow from operations to increase over the long-term primarily as a result of growth from our utilities and non-utility businesses. We
expect growth in our utilities to be driven primarily by capital spending to maintain and improve our electric generation and electric and natural gas
distribution infrastructure and to comply with new and existing state and federal regulations that will result in additional environmental and renewable
energy investments which will increase the base from which rates are determined. Our non-utility growth is expected from additional investments primarily in
our Gas Storage and Pipelines and Power and Industrial Projects segments.
We may be impacted by the timing of collection or refund of our various recovery and tracking mechanisms as a result of timing of MPSC orders.
Energy prices are likely to be a source of volatility with regard to working capital requirements for the foreseeable future. We are continuing our efforts to
identify opportunities to improve cash flow through working capital initiatives and maintaining flexibility in the timing and extent of our long-term capital
projects.
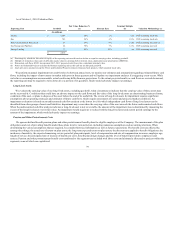
We have approximately $300 million in long-term debt maturing in the next twelve months. The repayment of the principal amount of the
Securitization debt is funded through a surcharge payable by DTE Electric’s customers. The repayment of the other debt is expected to be paid through
internally generated funds or the issuance of long-term debt.
DTE Energy has approximately $1.5 billion of available liquidity at December 31, 2014, consisting of cash and amounts available under unsecured
revolving credit agreements.
35