DTE Energy 2014 Annual Report Download - page 84
Download and view the complete annual report
Please find page 84 of the 2014 DTE Energy annual report below. You can navigate through the pages in the report by either clicking on the pages listed below, or by using the keyword search tool below to find specific information within the annual report.-
 1
1 -
2
-
3
-
4
-
5
-
6
-
7
-
8
-
9
-
10
-
11
-
12
-
13
-
14
-
15
-
16
-
17
-
18
-
19
-
20
-
21
-
22
-
23
-
24
-
25
-
26
-
27
-
28
-
29
-
30
-
31
-
32
-
33
-
34
-
35
-
36
-
37
-
38
-
39
-
40
-
41
-
42
-
43
-
44
-
45
-
46
-
47
-
48
-
49
-
50
-
51
-
52
-
53
-
54
-
55
-
56
-
57
-
58
-
59
-
60
-
61
-
62
-
63
-
64
-
65
-
66
-
67
-
68
-
69
-
70
-
71
-
72
-
73
-
 74
74 -
 75
75 -
 76
76 -
 77
77 -
 78
78 -
 79
79 -
 80
80 -
 81
81 -
 82
82 -
 83
83 -
 84
84 -
 85
85 -
 86
86 -
 87
87 -
 88
88 -
 89
89 -
 90
90 -
 91
91 -
 92
92 -
 93
93 -
 94
94 -
95
-
96
-
97
-
98
-
99
-
100
-
101
-
102
-
103
-
104
-
105
-
106
-
107
-
108
-
109
-
110
-
111
-
112
-
113
-
114
-
115
-
116
-
117
-
118
-
119
-
120
-
121
-
122
-
123
-
124
-
125
-
126
-
127
-
128
-
129
-
130
-
131
-
132
-
133
-
134
-
135
-
136
-
137
-
138
-
139
-
140
-
141
-
142
-
143
-
144
-
145
-
146
-
147
-
148
-
149
-
150
-
151
-
152
-
153
-
154
-
155
-
156
-
157
-
158
-
159
-
160
-
161
-
162
-
163
-
164
-
165
-
166
-
167
-
168
-
169
-
170
-
171
-
172
-
173
-
174
-
175
-
176
-
177
-
178
-
179
-
180
-
181
-
182
-
183
-
184
-
185
-
186
-
187
-
188
-
189
-
190
 |
 |

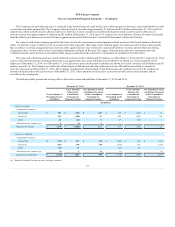
The Company also provides and receives collateral in the form of letters of credit which can be offset against net derivative assets and liabilities as well
as accounts receivable and payable. The Company had issued letters of credit of approximately $7 million and $19 million at December 31, 2014 and 2013,
respectively, which could be used to offset net derivative liabilities. Letters of credit received from third parties which could be used to offset our net
derivative assets were approximately $5 million and $1 million at December 31, 2014 and 2013, respectively. Such balances of letters of credit are excluded
from the tables below and are not netted with the recognized assets and liabilities in the Consolidated Statements of Financial Position.
For contracts with certain clearing agents the fair value of derivative instruments is netted against realized positions with the net balance reflected as
either 1) a derivative asset or liability or 2) an account receivable or payable. Other than certain clearing agents, accounts receivable and accounts payable
that are subject to netting arrangements have not been offset against the fair value of derivative assets and liabilities. Certain contracts that have netting
arrangements have not been offset in the Consolidated Statements of Financial Position. The impact of netting these derivative instruments and cash
collateral related to such contracts is not material. Only the gross amounts for these derivative instruments are included in the table below.
The total cash collateral posted, net of cash collateral received, was $61 million and $12 million as of December 31, 2014 and 2013, respectively. There
was no cash collateral related to unrealized positions to net against derivative assets while derivative liabilities are shown net of cash collateral of $19
million as of December 31, 2014. As of December 31, 2013, derivative assets and derivative liabilities are shown net of cash collateral of $26 million and $17
million, respectively. The Company recorded cash collateral paid of $44 million and cash collateral received of $2 million not related to unrealized
derivative positions as of December 31, 2014. The Company recorded cash collateral paid of $34 million and cash collateral received of $13 million not
related to unrealized derivative positions as of December 31, 2013. These amounts are included in accounts receivable and accounts payable and are
recorded net by counterparty.
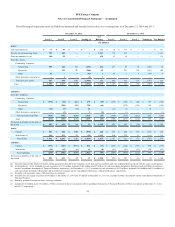
The following table presents the netting offsets of derivative assets and liabilities at December 31, 2014 and 2013:
Derivative assets:
Commodity Contracts:
Natural Gas
$ 396
$ (382)
$ 14
Electricity
400
(291)
109
Other
37
(34)
3
Other derivative contracts (a)
—
—
—
Total derivative assets
$ 833
$ (707)
$ 126
Derivative liabilities:
Commodity Contracts:
Natural Gas
$ (503)
$ 395
$ (108)
Electricity
(398)
269
(129)
Other
(34)
34
—
Other derivative contracts (a)
(1)
—
(1)
Total derivative liabilities
$ (936)
$ 698
$ (238)
_______________________________________
(a) Primarily includes Foreign currency exchange contracts
81