DTE Energy 2014 Annual Report Download - page 104
Download and view the complete annual report
Please find page 104 of the 2014 DTE Energy annual report below. You can navigate through the pages in the report by either clicking on the pages listed below, or by using the keyword search tool below to find specific information within the annual report.-
 1
1 -
2
-
3
-
4
-
5
-
6
-
7
-
8
-
9
-
10
-
11
-
12
-
13
-
14
-
15
-
16
-
17
-
18
-
19
-
20
-
21
-
22
-
23
-
24
-
25
-
26
-
27
-
28
-
29
-
30
-
31
-
32
-
33
-
34
-
35
-
36
-
37
-
38
-
39
-
40
-
41
-
42
-
43
-
44
-
45
-
46
-
47
-
48
-
49
-
50
-
51
-
52
-
53
-
54
-
55
-
56
-
57
-
58
-
59
-
60
-
61
-
62
-
63
-
64
-
65
-
66
-
67
-
68
-
69
-
70
-
71
-
72
-
73
-
74
-
75
-
76
-
77
-
78
-
79
-
80
-
81
-
82
-
83
-
84
-
85
-
86
-
87
-
88
-
89
-
90
-
91
-
92
-
93
-
 94
94 -
 95
95 -
 96
96 -
 97
97 -
 98
98 -
 99
99 -
 100
100 -
 101
101 -
 102
102 -
 103
103 -
 104
104 -
 105
105 -
 106
106 -
 107
107 -
 108
108 -
 109
109 -
 110
110 -
 111
111 -
 112
112 -
 113
113 -
 114
114 -
115
-
116
-
117
-
118
-
119
-
120
-
121
-
122
-
123
-
124
-
125
-
126
-
127
-
128
-
129
-
130
-
131
-
132
-
133
-
134
-
135
-
136
-
137
-
138
-
139
-
140
-
141
-
142
-
143
-
144
-
145
-
146
-
147
-
148
-
149
-
150
-
151
-
152
-
153
-
154
-
155
-
156
-
157
-
158
-
159
-
160
-
161
-
162
-
163
-
164
-
165
-
166
-
167
-
168
-
169
-
170
-
171
-
172
-
173
-
174
-
175
-
176
-
177
-
178
-
179
-
180
-
181
-
182
-
183
-
184
-
185
-
186
-
187
-
188
-
189
-
190
 |
 |
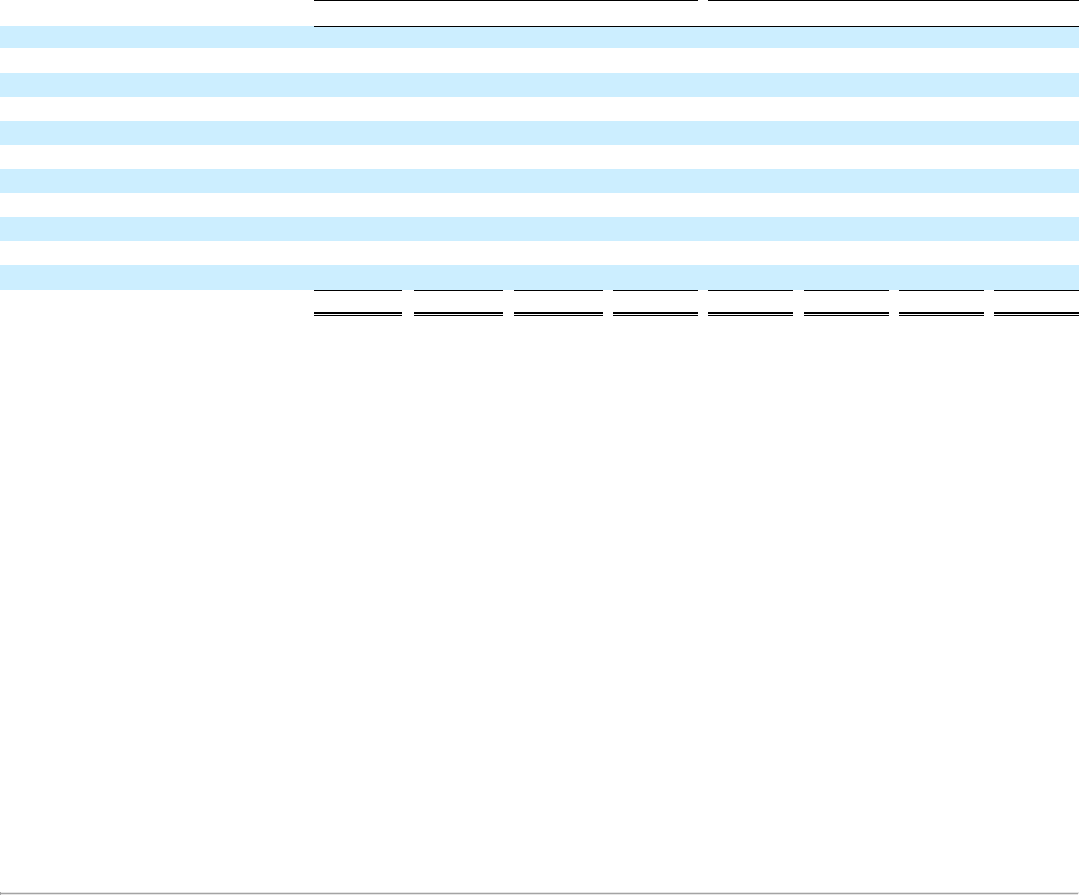
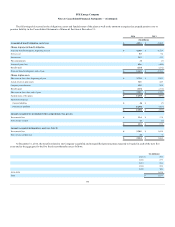
Fair Value Measurements for other postretirement benefit plan assets at December 31, 2014 and 2013 (a):
Short-term investments (b)
$ 5
$ —
$ —
$ 5
Equity securities
U.S. large cap (c)
302
—
—
302
U.S. small/mid cap (d)
147
—
—
147
Non U.S. (e)
282
9
—
291
Fixed income securities (f)
17
350
—
367
Hedge funds and similar investments (g)
130
25
159
314
Private equity and other (h)
—
—
101
101
Securities lending (i)
—
—
—
—
Securities lending collateral (i)
—
—
—
—
Total
$ 883
$ 384
$ 260
$ 1,527
_______________________________________
(a) For a description of levels within the fair value hierarchy see Note 11 to the Consolidated Financial Statements, "Fair Value".
(b) This category predominantly represents certain short-term fixed income securities and money market investments that are managed in separate accounts or commingled funds.
Pricing for investments in this category are obtained from quoted prices in actively traded markets or valuations from brokers or pricing services.
(c) This category comprises both actively and not actively managed portfolios that track the S&P 500 low cost equity index funds. Investments in this category are exchange-traded
securities whereby unadjusted quote prices can be obtained. Exchange-traded securities held in a commingled fund are classified as Level 2 assets.
(d) This category represents portfolios of small and medium capitalization domestic equities. Investments in this category are exchange-traded securities whereby unadjusted quote
prices can be obtained. Exchange-traded securities held in a commingled fund are classified as Level 2 assets.
(e) This category primarily consists of portfolios of non-U.S. developed and emerging market equities. Investments in this category are exchange-traded securities whereby
unadjusted quote prices can be obtained. Exchange-traded securities held in a commingled fund are classified as Level 2 assets.
(f) This category includes corporate bonds from diversified industries, U.S. Treasuries, bank loans and mortgage backed securities. Pricing for investments in this category is
obtained from quoted prices in actively traded markets and quotations from broker or pricing services. Non-exchange traded securities and exchange-traded securities held in
commingled funds are classified as Level 2 assets.
(g) This category utilizes a diversified group of strategies that attempt to capture financial market inefficiencies and includes publicly traded debt and equity, publicly traded mutual
funds, commingled and limited partnership funds and non-exchange traded securities. Pricing for Level 1 and Level 2 assets in this category is obtained from quoted prices in
actively traded markets and quoted prices from broker or pricing services. Non-exchange traded securities held in commingled funds are classified as Level 2 assets. Valuations
for some Level 3 assets in this category may be based on limited observable inputs as there may be little, if any, publicly available pricing.
(h) This category includes a diversified group of funds and strategies that primarily invests in private equity partnerships. This category also includes investments in timber and
private mezzanine debt. Pricing for investments in this category is based on limited observable inputs as there is little, if any, publicly available pricing. Valuations for assets in this
category may be based on discounted cash flow analyses, relevant publicly-traded comparables and comparable transactions.
(i) In 2014, DTE Energy began a securities lending program with a third party agent. The program allows the agent to lend certain securities from the Company's VEBA trust to
selected entities against receipt of collateral (in the form of cash) as provided for and determined in accordance with its securities lending agency agreement.
The VEBA trust holds debt and equity securities directly and indirectly through commingled funds and institutional mutual funds. Exchange-traded
debt and equity securities held directly are valued using quoted market prices in actively traded markets. The commingled funds and institutional mutual
funds hold exchange-traded equity or debt securities and are valued based on NAVs. Non-exchange traded fixed income securities are valued by the trustee
based upon quotations available from brokers or pricing services. A primary price source is identified by asset type, class or issue for each security. The
trustee monitors prices supplied by pricing services and may use a supplemental price source or change the primary price source of a given security if the
trustee challenges an assigned price and determines that another price source is considered to be preferable. DTE Energy has obtained an understanding of
how these prices are derived, including the nature and observability of the inputs used in deriving such prices. Additionally, DTE Energy selectively
corroborates the fair values of securities by comparison of market-based price sources.
101