DTE Energy 2014 Annual Report Download - page 79
Download and view the complete annual report
Please find page 79 of the 2014 DTE Energy annual report below. You can navigate through the pages in the report by either clicking on the pages listed below, or by using the keyword search tool below to find specific information within the annual report.-
 1
1 -
2
-
3
-
4
-
5
-
6
-
7
-
8
-
9
-
10
-
11
-
12
-
13
-
14
-
15
-
16
-
17
-
18
-
19
-
20
-
21
-
22
-
23
-
24
-
25
-
26
-
27
-
28
-
29
-
30
-
31
-
32
-
33
-
34
-
35
-
36
-
37
-
38
-
39
-
40
-
41
-
42
-
43
-
44
-
45
-
46
-
47
-
48
-
49
-
50
-
51
-
52
-
53
-
54
-
55
-
56
-
57
-
58
-
59
-
60
-
61
-
62
-
63
-
64
-
65
-
66
-
67
-
68
-
 69
69 -
 70
70 -
 71
71 -
 72
72 -
 73
73 -
 74
74 -
 75
75 -
 76
76 -
 77
77 -
 78
78 -
 79
79 -
 80
80 -
 81
81 -
 82
82 -
 83
83 -
 84
84 -
 85
85 -
 86
86 -
 87
87 -
 88
88 -
 89
89 -
90
-
91
-
92
-
93
-
94
-
95
-
96
-
97
-
98
-
99
-
100
-
101
-
102
-
103
-
104
-
105
-
106
-
107
-
108
-
109
-
110
-
111
-
112
-
113
-
114
-
115
-
116
-
117
-
118
-
119
-
120
-
121
-
122
-
123
-
124
-
125
-
126
-
127
-
128
-
129
-
130
-
131
-
132
-
133
-
134
-
135
-
136
-
137
-
138
-
139
-
140
-
141
-
142
-
143
-
144
-
145
-
146
-
147
-
148
-
149
-
150
-
151
-
152
-
153
-
154
-
155
-
156
-
157
-
158
-
159
-
160
-
161
-
162
-
163
-
164
-
165
-
166
-
167
-
168
-
169
-
170
-
171
-
172
-
173
-
174
-
175
-
176
-
177
-
178
-
179
-
180
-
181
-
182
-
183
-
184
-
185
-
186
-
187
-
188
-
189
-
190
 |
 |

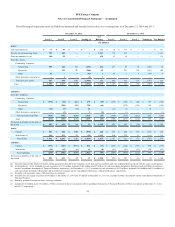
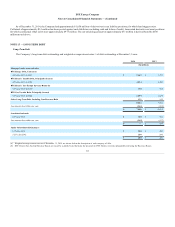
The following table presents the fair value reconciliation of Level 3 assets and liabilities measured at fair value on a recurring basis for the years ended
December 31, 2014 and 2013:
Net Assets (Liabilities) as of December 31
$ (38)
$ 23
$ 2
$ (13)
Transfers into Level 3 from Level 2
1
—
—
1
Transfers from Level 3 into Level 2
—
—
—
—
Total gains (losses):
Included in earnings
(32)
75
—
43
Recorded in regulatory assets/liabilities
—
—
5
5
Purchases, issuances and settlements:
Purchases
(8)
1
—
(7)
Issuances
—
(1)
—
(1)
Settlements
25
(85)
(4)
(64)
Net Assets (Liabilities) as of December 31
$ (52)
$ 13
$ 3
$ (36)
The amount of total gains (losses) included in net income
attributed to the change in unrealized gains (losses)
related to assets and liabilities held at December 31, 2014
and 2013 and reflected in Operating revenues and Fuel,
purchased power and gas in the Consolidated Statements
of Operations
$ (49)
$ 48
$ —
$ (1)
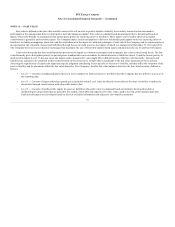
Derivatives are transferred between levels primarily due to changes in the source data used to construct price curves as a result of changes in market
liquidity. Transfers in and transfers out are reflected as if they had occurred at the beginning of the period. There were no transfers between levels 1 and 2
during the years ended December 31, 2014 and 2013.
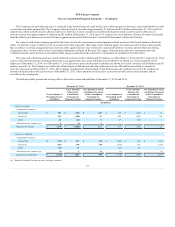
The following tables present the unobservable inputs related to Level 3 assets and liabilities as of December 31, 2014 and 2013:
Natural Gas
Electricity
Natural Gas
$ 34
$ (86)
Discounted
Cash Flow
Forward basis price (per MMBtu)
$ (0.88
)
—
$ 5.07/MMBtu
$ (0.16)/MMBtu
Electricity
$ 139
$ (126)
Discounted
Cash Flow
Forward basis price (per MWh)
$ (7
)
—
$ 15/MWh
$ 3/MWh
The unobservable inputs used in the fair value measurement of the electricity and natural gas commodity types consist of inputs that are less observable
due in part to lack of available broker quotes, supported by little, if any, market activity at the measurement date or are based on internally developed
models. Certain basis prices (i.e., the difference in pricing between two locations) included in the valuation of natural gas and electricity contracts were
deemed unobservable.
The inputs listed above would have a direct impact on the fair values of the above security types if they were adjusted. A significant increase (decrease)
in the basis price would result in a higher (lower) fair value for long positions, with offsetting impacts to short positions.
76