DTE Energy 2014 Annual Report Download - page 8
Download and view the complete annual report
Please find page 8 of the 2014 DTE Energy annual report below. You can navigate through the pages in the report by either clicking on the pages listed below, or by using the keyword search tool below to find specific information within the annual report.-
 1
1 -
 2
2 -
 3
3 -
 4
4 -
 5
5 -
 6
6 -
 7
7 -
 8
8 -
 9
9 -
 10
10 -
 11
11 -
 12
12 -
 13
13 -
 14
14 -
 15
15 -
 16
16 -
 17
17 -
 18
18 -
 19
19 -
20
-
21
-
22
-
23
-
24
-
25
-
26
-
27
-
28
-
29
-
30
-
31
-
32
-
33
-
34
-
35
-
36
-
37
-
38
-
39
-
40
-
41
-
42
-
43
-
44
-
45
-
46
-
47
-
48
-
49
-
50
-
51
-
52
-
53
-
54
-
55
-
56
-
57
-
58
-
59
-
60
-
61
-
62
-
63
-
64
-
65
-
66
-
67
-
68
-
69
-
70
-
71
-
72
-
73
-
74
-
75
-
76
-
77
-
78
-
79
-
80
-
81
-
82
-
83
-
84
-
85
-
86
-
87
-
88
-
89
-
90
-
91
-
92
-
93
-
94
-
95
-
96
-
97
-
98
-
99
-
100
-
101
-
102
-
103
-
104
-
105
-
106
-
107
-
108
-
109
-
110
-
111
-
112
-
113
-
114
-
115
-
116
-
117
-
118
-
119
-
120
-
121
-
122
-
123
-
124
-
125
-
126
-
127
-
128
-
129
-
130
-
131
-
132
-
133
-
134
-
135
-
136
-
137
-
138
-
139
-
140
-
141
-
142
-
143
-
144
-
145
-
146
-
147
-
148
-
149
-
150
-
151
-
152
-
153
-
154
-
155
-
156
-
157
-
158
-
159
-
160
-
161
-
162
-
163
-
164
-
165
-
166
-
167
-
168
-
169
-
170
-
171
-
172
-
173
-
174
-
175
-
176
-
177
-
178
-
179
-
180
-
181
-
182
-
183
-
184
-
185
-
186
-
187
-
188
-
189
-
190
 |
 |

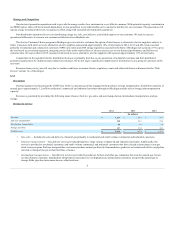
Weather, economic factors, competition and electricity prices affect sales levels to customers. Our peak load and highest total system sales generally
occur during the third quarter of the year, driven by air conditioning, and other cooling-related demands. Our operations are not dependent upon a limited
number of customers and the loss of any one or a few customers would not have a material adverse effect on DTE Electric.
Our power is generated from a variety of fuels and is supplemented with purchased power. We expect to have an adequate supply of fuel and purchased
power to meet our obligation to serve customers. Our generating capability is heavily dependent upon the availability of coal. Coal is purchased from various
sources in different geographic areas under agreements that vary in both pricing and terms. We expect to obtain the majority of our coal requirements through
long-term contracts, with the balance to be obtained through short-term agreements and spot purchases. We have long-term and short-term contracts for the
purchase of approximately 30.3 million tons of low-sulfur western coal and approximately 3.5 million tons of Appalachian coal to be delivered from 2015 to
2017. All of these contracts have pricing schedules. We have approximately 91% of our 2015 expected coal requirements under contract. Given the
geographic diversity of supply, we believe we can meet our expected generation requirements. We lease a fleet of rail cars and have our expected western coal
rail requirements under contract through 2018. All of our expected eastern coal rail requirements are under contract through 2016. Contracts covering
expected vessel transportation requirements for delivery of purchased coal to our generating facilities are currently being negotiated.
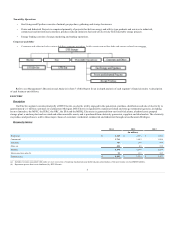
DTE Electric participates in the energy market through MISO. We offer our generation in the market on a day-ahead and real-time basis and bid for
power in the market to serve our load. We are a net purchaser of power that supplements our generation capability to meet customer demand during peak
cycles or during major plant outages.
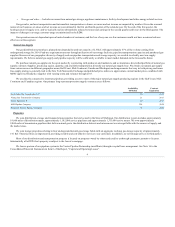
DTE Electric owns generating plants and facilities that are located in the State of Michigan. Substantially all of DTE Electric's property is subject to the
lien of a mortgage.
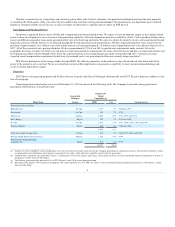
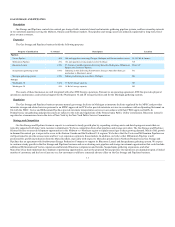
Generating plants owned and in service as of December 31, 2014 are shown in the following table. The Company's renewable energy generation,
principally wind turbines, is described below.
Fossil-fueled Steam-Electric
Belle River (b)
St. Clair
1,036
9.9
1984 and 1985
Greenwood
St. Clair
785
7.5
1979
Monroe (c)
Monroe
3,080
29.5
1971, 1973 and 1974
River Rouge
Wayne
542
5.2
1957 and 1958
St. Clair
St. Clair
1,398
13.4
1953, 1954, 1959, 1961 and 1969
Trenton Channel
Wayne
609
5.8
1949 and 1968
7,450
71.3
Oil or Gas-fueled Peaking Units
Various
936
9.0
1966-1971, 1981 and 1999
Nuclear-fueled Steam-Electric Fermi 2
Monroe
1,124
10.8
1988
Hydroelectric Pumped Storage
Ludington (d)
Mason
917
8.9
1973
10,427
100.0
_______________________________________
(a) Summer net rated capabilities of generating plants in service are based on periodic load tests and are changed depending on operating experience, the physical condition of units,
environmental control limitations and customer requirements for steam, which otherwise would be used for electric generation.
(b) The Belle River capability represents DTE Electric’s entitlement to 81% of the capacity and energy of the plant. See Note 6 to the Consolidated Financial Statements in Item 8 of
this Report, "Jointly Owned Utility Plant".
(c) The Monroe generating plant provided 38% of DTE Electric’s total 2014 power plant generation.
(d) Represents DTE Electric’s 49% interest in Ludington with a total capability of 1,872 MW. See Note 6 to the Consolidated Financial Statements in Item 8 of this Report, "Jointly
Owned Utility Plant".
6