DTE Energy 2014 Annual Report Download - page 11
Download and view the complete annual report
Please find page 11 of the 2014 DTE Energy annual report below. You can navigate through the pages in the report by either clicking on the pages listed below, or by using the keyword search tool below to find specific information within the annual report.-
 1
1 -
 2
2 -
 3
3 -
 4
4 -
 5
5 -
 6
6 -
 7
7 -
 8
8 -
 9
9 -
 10
10 -
 11
11 -
 12
12 -
 13
13 -
 14
14 -
 15
15 -
 16
16 -
 17
17 -
 18
18 -
 19
19 -
 20
20 -
 21
21 -
 22
22 -
23
-
24
-
25
-
26
-
27
-
28
-
29
-
30
-
31
-
32
-
33
-
34
-
35
-
36
-
37
-
38
-
39
-
40
-
41
-
42
-
43
-
44
-
45
-
46
-
47
-
48
-
49
-
50
-
51
-
52
-
53
-
54
-
55
-
56
-
57
-
58
-
59
-
60
-
61
-
62
-
63
-
64
-
65
-
66
-
67
-
68
-
69
-
70
-
71
-
72
-
73
-
74
-
75
-
76
-
77
-
78
-
79
-
80
-
81
-
82
-
83
-
84
-
85
-
86
-
87
-
88
-
89
-
90
-
91
-
92
-
93
-
94
-
95
-
96
-
97
-
98
-
99
-
100
-
101
-
102
-
103
-
104
-
105
-
106
-
107
-
108
-
109
-
110
-
111
-
112
-
113
-
114
-
115
-
116
-
117
-
118
-
119
-
120
-
121
-
122
-
123
-
124
-
125
-
126
-
127
-
128
-
129
-
130
-
131
-
132
-
133
-
134
-
135
-
136
-
137
-
138
-
139
-
140
-
141
-
142
-
143
-
144
-
145
-
146
-
147
-
148
-
149
-
150
-
151
-
152
-
153
-
154
-
155
-
156
-
157
-
158
-
159
-
160
-
161
-
162
-
163
-
164
-
165
-
166
-
167
-
168
-
169
-
170
-
171
-
172
-
173
-
174
-
175
-
176
-
177
-
178
-
179
-
180
-
181
-
182
-
183
-
184
-
185
-
186
-
187
-
188
-
189
-
190
 |
 |

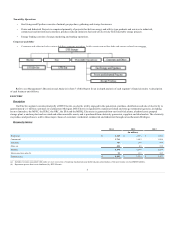
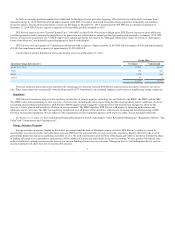
•Storage and other — Includes revenues from natural gas storage, appliance maintenance, facility development and other energy-related services.
Our gas sales, end user transportation and intermediate transportation volumes, revenues and net income are impacted by weather. Given the seasonal
nature of our business, revenues and net income are concentrated in the first and fourth quarters of the calendar year. By the end of the first quarter, the
heating season is largely over, and we typically realize substantially reduced revenues and earnings in the second quarter and losses in the third quarter. The
impacts of changes in average customer usage are minimized by the RDM.
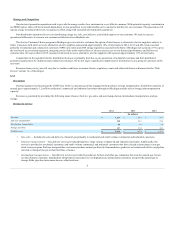
Our operations are not dependent upon a limited number of customers, and the loss of any one or a few customers would not have a material adverse
effect on our Gas segment.
Our gas distribution system has a planned maximum daily send-out capacity of 2.5 Bcf, with approximately 67% of the volume coming from
underground storage for 2014. Peak-use requirements are met through utilization of our storage facilities, pipeline transportation capacity and purchased gas
supplies. Because of our geographic diversity of supply and our pipeline transportation and storage capacity, we are able to reliably meet our supply
requirements. We believe natural gas supply and pipeline capacity will be sufficiently available to meet market demands in the foreseeable future.
We purchase natural gas supplies in the open market by contracting with producers and marketers, and we maintain a diversified portfolio of natural gas
supply contracts. Supplier, producing region, quantity, and available transportation diversify our natural gas supply base. We obtain our natural gas supply
from various sources in different geographic areas (Gulf Coast, Mid-Continent, Canada and Michigan) under agreements that vary in both pricing and terms.
Gas supply pricing is generally tied to the New York Mercantile Exchange and published price indices to approximate current market prices combined with
MPSC approved fixed price supplies with varying terms and volumes through 2017.
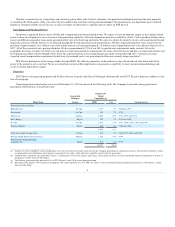
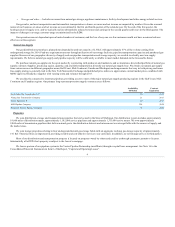
We are directly connected to interstate pipelines, providing access to most of the major natural gas supply producing regions in the Gulf Coast, Mid-
Continent and Canadian regions. Our primary long-term transportation supply contracts are as follows:
Great Lakes Gas Transmission L.P. 30
2017
Viking Gas Transmission Company 21
2017
Vector Pipeline L.P. 50
2017
ANR Pipeline Company 224
2028
Panhandle Eastern Pipeline Company 75
2029
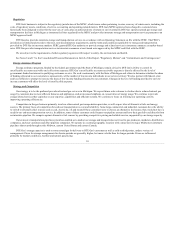
We own distribution, storage and transportation properties that are located in the State of Michigan. Our distribution system includes approximately
19,000 miles of distribution mains, approximately 1,162,000 service pipelines and approximately 1,313,000 active meters. We own approximately
2,000 miles of transmission pipelines that deliver natural gas to the distribution districts and interconnect our storage fields with the sources of supply and
the market areas.
We own storage properties relating to four underground natural gas storage fields with an aggregate working gas storage capacity of approximately
141 Bcf. These facilities are important in providing reliable and cost-effective service to our customers. In addition, we sell storage services to third parties.
Most of our distribution and transportation property is located on property owned by others and used by us through easements, permits or licenses.
Substantially all of DTE Gas's property is subject to the lien of a mortgage.
We lease a portion of our pipeline system to the Vector Pipeline Partnership (an affiliate) through a capital lease arrangement. See Note 16 to the
Consolidated Financial Statements in Item 8 of the Report, "Capital and Operating Leases".
9