DTE Energy 2014 Annual Report Download - page 29
Download and view the complete annual report
Please find page 29 of the 2014 DTE Energy annual report below. You can navigate through the pages in the report by either clicking on the pages listed below, or by using the keyword search tool below to find specific information within the annual report.-
 1
1 -
2
-
3
-
4
-
5
-
6
-
7
-
8
-
9
-
10
-
11
-
12
-
13
-
14
-
15
-
16
-
17
-
18
-
 19
19 -
 20
20 -
 21
21 -
 22
22 -
 23
23 -
 24
24 -
 25
25 -
 26
26 -
 27
27 -
 28
28 -
 29
29 -
 30
30 -
 31
31 -
 32
32 -
 33
33 -
 34
34 -
 35
35 -
 36
36 -
 37
37 -
 38
38 -
 39
39 -
40
-
41
-
42
-
43
-
44
-
45
-
46
-
47
-
48
-
49
-
50
-
51
-
52
-
53
-
54
-
55
-
56
-
57
-
58
-
59
-
60
-
61
-
62
-
63
-
64
-
65
-
66
-
67
-
68
-
69
-
70
-
71
-
72
-
73
-
74
-
75
-
76
-
77
-
78
-
79
-
80
-
81
-
82
-
83
-
84
-
85
-
86
-
87
-
88
-
89
-
90
-
91
-
92
-
93
-
94
-
95
-
96
-
97
-
98
-
99
-
100
-
101
-
102
-
103
-
104
-
105
-
106
-
107
-
108
-
109
-
110
-
111
-
112
-
113
-
114
-
115
-
116
-
117
-
118
-
119
-
120
-
121
-
122
-
123
-
124
-
125
-
126
-
127
-
128
-
129
-
130
-
131
-
132
-
133
-
134
-
135
-
136
-
137
-
138
-
139
-
140
-
141
-
142
-
143
-
144
-
145
-
146
-
147
-
148
-
149
-
150
-
151
-
152
-
153
-
154
-
155
-
156
-
157
-
158
-
159
-
160
-
161
-
162
-
163
-
164
-
165
-
166
-
167
-
168
-
169
-
170
-
171
-
172
-
173
-
174
-
175
-
176
-
177
-
178
-
179
-
180
-
181
-
182
-
183
-
184
-
185
-
186
-
187
-
188
-
189
-
190
 |
 |

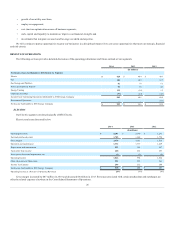
The following table details changes in various gross margin components relative to the comparable prior period:
Amortization of refundable revenue decoupling/deferred gain
$ —
Base sales, inclusive of weather effect
(54)
Securitization bond and tax surcharge
39
Renewable energy program
19
Low income energy assistance surcharge
(12)
Regulatory mechanisms and other
4
Increase (decrease) in gross margin
$ (4)
Residential
15,273
15,666
Commercial
16,661
16,832
Industrial
10,303
9,989
Other
942
958
43,179
43,445
Interconnection sales (a)
3,883
2,125
Total Electric Sales
47,062
45,570
Retail and Wholesale
43,179
43,445
Electric Customer Choice, including self generators (b)
5,200
5,197
Total Electric Sales and Deliveries
48,379
48,642
______________________________
(a) Represents power that is not distributed by DTE Electric.
(b) Represents deliveries for self generators who have purchased power from alternative energy suppliers to supplement their power requirements.
Operation and maintenance expense decreased $45 million in 2014 and decreased $52 million in 2013. The decrease in 2014 is primarily due to
decreased employee benefit expenses of $68 million, decreased distribution operations expenses of $36 million, and decreased power plant generation
expenses of $7 million, partially offset by higher restoration and line clearance expenses of $19 million, increased low income energy assistance of $17
million, and increased energy optimization and renewable energy expenses of $13 million. In addition, 2014 included $17 million of expenses related to the
transition of PLD customers to DTE Electric's distribution system effective July 1, 2014. In May 2014, the MPSC approved a TRM that provides for recovery
of the deferred net incremental revenue requirement associated with the transition that is reflected in the Depreciation and amortization line in the
Consolidated Statement of Operations. The decrease in 2013 is primarily due to decreased employee benefit expenses of $90 million, decreased power plant
generation expenses of $14 million and decreased low income energy assistance of $12 million, partially offset by increased restoration and line clearance
expenses of $19 million, increased corporate administrative expenses of $17 million, increased uncollectible expenses of $11 million, increased energy
optimization and renewable energy expenses of $8 million and increased distribution operations expenses of $8 million.
Depreciation and amortization expense increased $31 million in 2014 and increased $75 million in 2013. The 2014 increase was due to $42 million of
increased expense due to an increased depreciable base, increased amortization of regulatory assets of $3 million, primarily related to Securitization, partially
offset by $14 million associated with the TRM. The 2013 increase was due to increased amortization of regulatory assets of $57 million, primarily related to
Securitization, and increased depreciation of $18 million due to an increased depreciable base.
Other (income) and deductions decreased $36 million in 2014 and decreased $3 million in 2013. The decrease in 2014 was primarily due to decreased
interest expenses of $18 million and the 2013 contribution to the DTE Energy Foundation of $18 million. The decrease in 2013 was primarily due to 2012
one time expenses of $11 million related to Michigan ballot proposals and increased investment earnings of $10 million, offset by a contribution to the DTE
Energy Foundation of $18 million.
27