DTE Energy 2014 Annual Report Download - page 32
Download and view the complete annual report
Please find page 32 of the 2014 DTE Energy annual report below. You can navigate through the pages in the report by either clicking on the pages listed below, or by using the keyword search tool below to find specific information within the annual report.-
 1
1 -
2
-
3
-
4
-
5
-
6
-
7
-
8
-
9
-
10
-
11
-
12
-
13
-
14
-
15
-
16
-
17
-
18
-
19
-
20
-
21
-
 22
22 -
 23
23 -
 24
24 -
 25
25 -
 26
26 -
 27
27 -
 28
28 -
 29
29 -
 30
30 -
 31
31 -
 32
32 -
 33
33 -
 34
34 -
 35
35 -
 36
36 -
 37
37 -
 38
38 -
 39
39 -
 40
40 -
 41
41 -
 42
42 -
43
-
44
-
45
-
46
-
47
-
48
-
49
-
50
-
51
-
52
-
53
-
54
-
55
-
56
-
57
-
58
-
59
-
60
-
61
-
62
-
63
-
64
-
65
-
66
-
67
-
68
-
69
-
70
-
71
-
72
-
73
-
74
-
75
-
76
-
77
-
78
-
79
-
80
-
81
-
82
-
83
-
84
-
85
-
86
-
87
-
88
-
89
-
90
-
91
-
92
-
93
-
94
-
95
-
96
-
97
-
98
-
99
-
100
-
101
-
102
-
103
-
104
-
105
-
106
-
107
-
108
-
109
-
110
-
111
-
112
-
113
-
114
-
115
-
116
-
117
-
118
-
119
-
120
-
121
-
122
-
123
-
124
-
125
-
126
-
127
-
128
-
129
-
130
-
131
-
132
-
133
-
134
-
135
-
136
-
137
-
138
-
139
-
140
-
141
-
142
-
143
-
144
-
145
-
146
-
147
-
148
-
149
-
150
-
151
-
152
-
153
-
154
-
155
-
156
-
157
-
158
-
159
-
160
-
161
-
162
-
163
-
164
-
165
-
166
-
167
-
168
-
169
-
170
-
171
-
172
-
173
-
174
-
175
-
176
-
177
-
178
-
179
-
180
-
181
-
182
-
183
-
184
-
185
-
186
-
187
-
188
-
189
-
190
 |
 |

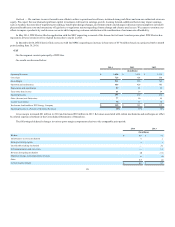
Depreciation and amortization expense increased $11 million in 2014 and increased $15 million in 2013. The increases were due primarily to the
growth of the Bluestone and Susquehanna projects.
Other (income) and deductions decreased $17 million in 2014 and decreased $4 million in 2013. The decreases were due to decreased earnings from a
pipeline investment and increased intercompany interest expense. The earnings from the pipeline investment were negatively impacted by a revenue deferral
for depreciation collected in FERC-approved tariff rates in excess of depreciation expense.
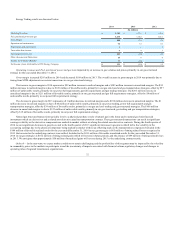
Outlook — Our Gas Storage and Pipelines business expects to maintain its steady growth by developing an asset portfolio with multiple growth
platforms through investment in new projects and expansions. We will continue to look for additional investment opportunities and other storage and
pipeline projects at favorable prices. The capacity expansion of Bluestone lateral pipeline in Susquehanna County, Pennsylvania and Broome County, New
York, is progressing as planned. In 2014, we added a new compressor facility and 3.5 miles of 24-inch pipeline loop, expanding the system to 47.5 miles of
pipe in service. Expansion activities over the next twelve months include a second compressor facility and approximately 6 miles of additional pipeline loop
to accommodate increased shipper demand. Through our long term agreement with Southwestern Energy Production Company, we believe Bluestone lateral
and Susquehanna gathering system are strategically positioned for future growth of the Marcellus shale.
Progress continues on preliminary development activities on the proposed Nexus pipeline, a transportation path for natural gas from the Utica shale in
Ohio to Michigan and Ontario. During 2014, several producers signed agreements as shippers, indicating their firm volume commitment subject to certain
conditions customary in the pipeline industry. We are planning to have a partnership interest in the Nexus pipeline.
Power and Industrial Projects is comprised primarily of projects that deliver energy and utility-type products and services to industrial, commercial and
institutional customers; produce REF and sell electricity from renewable energy projects.
Power and Industrial Projects results are discussed below:
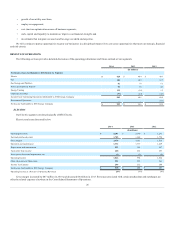
Operating Revenues
$ 1,950
$ 1,823
Operation and maintenance
1,914
1,788
Depreciation and amortization
72
65
Taxes other than income
15
16
Asset (gains) losses and impairments, net
(4)
(5)
Operating Loss
(47)
(41)
Other (Income) and Deductions
(73)
(44)
Income Taxes
Expense (Benefits)
8
—
Production Tax Credits
(53)
(44)
(45)
(44)
Net Income
71
47
Noncontrolling Interests
5
5
Net Income Attributable to DTE Energy Company
$ 66
$ 42
Operating revenues increased $339 million in 2014 and increased $127 million in 2013. The 2014 increase is primarily due to a $354 million increase
associated with higher volumes from REF projects and a $32 million increase associated with the start-up of a renewable power project, partially offset by a
$46 million decrease due primarily to lower coal prices associated with the steel business. The 2013 increase is primarily due to a $161 million increase
associated with higher volumes from REF projects and a $102 million increase due to the on-site energy projects acquired in the 2012 fourth quarter,
partially offset by a $75 million decrease from exiting the coal transportation and marketing business and a $63 million decrease due primarily to lower coal
prices associated with the steel business.
30