DTE Energy 2014 Annual Report Download - page 46
Download and view the complete annual report
Please find page 46 of the 2014 DTE Energy annual report below. You can navigate through the pages in the report by either clicking on the pages listed below, or by using the keyword search tool below to find specific information within the annual report.-
 1
1 -
2
-
3
-
4
-
5
-
6
-
7
-
8
-
9
-
10
-
11
-
12
-
13
-
14
-
15
-
16
-
17
-
18
-
19
-
20
-
21
-
22
-
23
-
24
-
25
-
26
-
27
-
28
-
29
-
30
-
31
-
32
-
33
-
34
-
35
-
 36
36 -
 37
37 -
 38
38 -
 39
39 -
 40
40 -
 41
41 -
 42
42 -
 43
43 -
 44
44 -
 45
45 -
 46
46 -
 47
47 -
 48
48 -
 49
49 -
 50
50 -
 51
51 -
 52
52 -
 53
53 -
 54
54 -
 55
55 -
 56
56 -
57
-
58
-
59
-
60
-
61
-
62
-
63
-
64
-
65
-
66
-
67
-
68
-
69
-
70
-
71
-
72
-
73
-
74
-
75
-
76
-
77
-
78
-
79
-
80
-
81
-
82
-
83
-
84
-
85
-
86
-
87
-
88
-
89
-
90
-
91
-
92
-
93
-
94
-
95
-
96
-
97
-
98
-
99
-
100
-
101
-
102
-
103
-
104
-
105
-
106
-
107
-
108
-
109
-
110
-
111
-
112
-
113
-
114
-
115
-
116
-
117
-
118
-
119
-
120
-
121
-
122
-
123
-
124
-
125
-
126
-
127
-
128
-
129
-
130
-
131
-
132
-
133
-
134
-
135
-
136
-
137
-
138
-
139
-
140
-
141
-
142
-
143
-
144
-
145
-
146
-
147
-
148
-
149
-
150
-
151
-
152
-
153
-
154
-
155
-
156
-
157
-
158
-
159
-
160
-
161
-
162
-
163
-
164
-
165
-
166
-
167
-
168
-
169
-
170
-
171
-
172
-
173
-
174
-
175
-
176
-
177
-
178
-
179
-
180
-
181
-
182
-
183
-
184
-
185
-
186
-
187
-
188
-
189
-
190
 |
 |

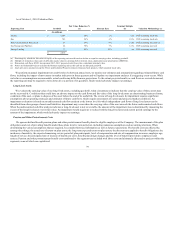
The following table displays the credit quality of our trading counterparties as of December 31, 2014:
Investment Grade (a)
A− and Greater $ 203
$ —
$ 203
BBB+ and BBB 229
—
229
BBB− 61
—
61
Total Investment Grade 493
—
493
Non-investment grade (b) 2
—
2
Internally Rated — investment grade (c) 240
(1)
239
Internally Rated — non-investment grade (d) 16
(1)
15
Total $ 751
$ (2)
$ 749
_______________________________________
(a) This category includes counterparties with minimum credit ratings of Baa3 assigned by Moody’s Investors Service (Moody’s) and BBB- assigned by Standard & Poor’s Rating
Group, a division of McGraw-Hill Companies, Inc. (Standard & Poor’s). The five largest counterparty exposures, combined, for this category represented approximately 14% of
the total gross credit exposure.
(b) This category includes counterparties with credit ratings that are below investment grade. The five largest counterparty exposures, combined, for this category represented less
than 1% of the total gross credit exposure.
(c) This category includes counterparties that have not been rated by Moody’s or Standard & Poor’s, but are considered investment grade based on DTE Energy’s evaluation of the
counterparty’s creditworthiness. The five largest counterparty exposures, combined, for this category represented approximately 14% of the total gross credit exposure.
(d) This category includes counterparties that have not been rated by Moody’s or Standard & Poor’s, and are considered non-investment grade based on DTE Energy’s evaluation of
the counterparty’s creditworthiness. The five largest counterparty exposures, combined, for this category represented approximately 2% of the total gross credit exposure.
We are subject to interest rate risk in connection with the issuance of debt. In order to manage interest costs, we may use treasury locks and interest rate
swap agreements. Our exposure to interest rate risk arises primarily from changes in U.S. Treasury rates, commercial paper rates and London Inter-Bank
Offered Rates (LIBOR). As of December 31, 2014, we had a floating rate debt-to-total debt ratio of approximately 4.6% (excluding securitized debt).
We have foreign currency exchange risk arising from market price fluctuations associated with fixed priced contracts. These contracts are denominated
in Canadian dollars and are primarily for the purchase and sale of natural gas and power as well as for long-term transportation capacity. To limit our
exposure to foreign currency exchange fluctuations, we have entered into a series of foreign currency exchange forward contracts through April 2019.
We performed a sensitivity analysis on the fair values of our commodity contracts, long-term debt obligations and foreign currency exchange forward
contracts. The commodity contracts and foreign currency exchange risk listed below principally relate to our energy marketing and trading activities. The
sensitivity analysis involved increasing and decreasing forward rates at December 31, 2014 and 2013 by a hypothetical 10% and calculating the resulting
change in the fair values.
44