DTE Energy 2014 Annual Report Download - page 31
Download and view the complete annual report
Please find page 31 of the 2014 DTE Energy annual report below. You can navigate through the pages in the report by either clicking on the pages listed below, or by using the keyword search tool below to find specific information within the annual report.-
 1
1 -
2
-
3
-
4
-
5
-
6
-
7
-
8
-
9
-
10
-
11
-
12
-
13
-
14
-
15
-
16
-
17
-
18
-
19
-
20
-
 21
21 -
 22
22 -
 23
23 -
 24
24 -
 25
25 -
 26
26 -
 27
27 -
 28
28 -
 29
29 -
 30
30 -
 31
31 -
 32
32 -
 33
33 -
 34
34 -
 35
35 -
 36
36 -
 37
37 -
 38
38 -
 39
39 -
 40
40 -
 41
41 -
42
-
43
-
44
-
45
-
46
-
47
-
48
-
49
-
50
-
51
-
52
-
53
-
54
-
55
-
56
-
57
-
58
-
59
-
60
-
61
-
62
-
63
-
64
-
65
-
66
-
67
-
68
-
69
-
70
-
71
-
72
-
73
-
74
-
75
-
76
-
77
-
78
-
79
-
80
-
81
-
82
-
83
-
84
-
85
-
86
-
87
-
88
-
89
-
90
-
91
-
92
-
93
-
94
-
95
-
96
-
97
-
98
-
99
-
100
-
101
-
102
-
103
-
104
-
105
-
106
-
107
-
108
-
109
-
110
-
111
-
112
-
113
-
114
-
115
-
116
-
117
-
118
-
119
-
120
-
121
-
122
-
123
-
124
-
125
-
126
-
127
-
128
-
129
-
130
-
131
-
132
-
133
-
134
-
135
-
136
-
137
-
138
-
139
-
140
-
141
-
142
-
143
-
144
-
145
-
146
-
147
-
148
-
149
-
150
-
151
-
152
-
153
-
154
-
155
-
156
-
157
-
158
-
159
-
160
-
161
-
162
-
163
-
164
-
165
-
166
-
167
-
168
-
169
-
170
-
171
-
172
-
173
-
174
-
175
-
176
-
177
-
178
-
179
-
180
-
181
-
182
-
183
-
184
-
185
-
186
-
187
-
188
-
189
-
190
 |
 |

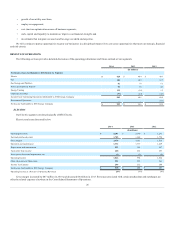
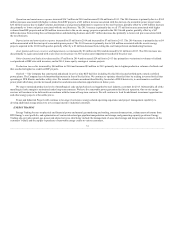
Gas sales
128
104
End user transportation
157
157
285
261
Intermediate transportation
300
264
585
525
Operation and maintenance expense increased $27 million in 2014 and increased $44 million in 2013. The increase in 2014 is primarily due to
increased gas operations expenses of $32 million, increased uncollectible expenses of $4 million, and increased corporate administrative expenses of $3
million, partially offset by decreased employee benefit expenses of $10 million and reduced energy optimization expenses of $2 million. The increase in
2013 is primarily due to increased gas operations expenses of $24 million, increased maintenance and repair costs of $14 million, increased transmission
costs of $14 million, increased corporate administrative expenses of $8 million and increased uncollectible expenses of $5 million, partially offset by
decreased employee benefit expenses of $19 million and decreased energy optimization expenses of $3 million.
Other (income) and deductions increased $27 million in 2014 and decreased $19 million in 2013. The increase in 2014 is primarily due to
contributions to the DTE Energy Foundation and other charitable organizations in 2014. The decrease in 2013 is due to lack of a contribution to the DTE
Energy Foundation in 2013, partially offset by a $5 million contribution to low income energy assistance funds.
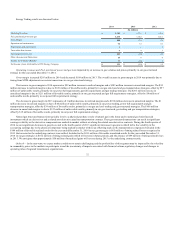
Outlook — We continue to move forward in our efforts to achieve operational excellence, sustained strong cash flows and earn our authorized return on
equity. We expect that our planned significant infrastructure capital investments will result in earnings growth. Looking forward, additional factors may
impact earnings such as weather, the outcome of regulatory proceedings, benefit plan design changes, and investment returns and changes in discount rate
assumptions in benefit plans and health care costs. We expect to continue our efforts to improve productivity and decrease our costs while improving
customer satisfaction with consideration of customer rate affordability.
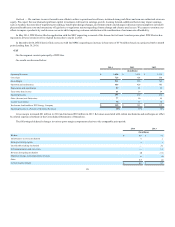
Our Gas Storage and Pipelines segment consists of our non-utility gas pipelines and storage businesses.
Gas Storage and Pipelines results are discussed below:
Operating Revenues
$ 132
$ 96
Operation and Maintenance
25
19
Depreciation and Amortization
23
8
Taxes Other Than Income
3
3
Asset (Gains) and Losses and Reserves, Net
—
3
Operating Income
81
63
Other (Income) and Deductions
(36)
(40)
Income Tax Expense
45
39
Net Income
72
64
Noncontrolling interest
2
3
Net Income Attributable to DTE Energy
$ 70
$ 61
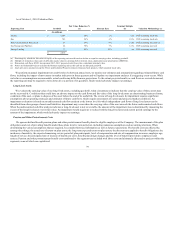
Operating revenues increased $71 million in 2014 and increased $36 million in 2013. The increases were due primarily to increased volumes on the
Bluestone pipeline and additional segments placed in service in the Susquehanna gathering system. Storage revenue also increased due to weather
favorability in early 2014, partially offset by lower market rates.
Operation and maintenance expense increased $21 million in 2014 and increased $6 million in 2013. The increases were due primarily to increased
activity on the Bluestone and Susquehanna projects and increased corporate overheads due to growth of this segment.
29