DTE Energy 2014 Annual Report Download - page 42
Download and view the complete annual report
Please find page 42 of the 2014 DTE Energy annual report below. You can navigate through the pages in the report by either clicking on the pages listed below, or by using the keyword search tool below to find specific information within the annual report.-
 1
1 -
2
-
3
-
4
-
5
-
6
-
7
-
8
-
9
-
10
-
11
-
12
-
13
-
14
-
15
-
16
-
17
-
18
-
19
-
20
-
21
-
22
-
23
-
24
-
25
-
26
-
27
-
28
-
29
-
30
-
31
-
 32
32 -
 33
33 -
 34
34 -
 35
35 -
 36
36 -
 37
37 -
 38
38 -
 39
39 -
 40
40 -
 41
41 -
 42
42 -
 43
43 -
 44
44 -
 45
45 -
 46
46 -
 47
47 -
 48
48 -
 49
49 -
 50
50 -
 51
51 -
 52
52 -
53
-
54
-
55
-
56
-
57
-
58
-
59
-
60
-
61
-
62
-
63
-
64
-
65
-
66
-
67
-
68
-
69
-
70
-
71
-
72
-
73
-
74
-
75
-
76
-
77
-
78
-
79
-
80
-
81
-
82
-
83
-
84
-
85
-
86
-
87
-
88
-
89
-
90
-
91
-
92
-
93
-
94
-
95
-
96
-
97
-
98
-
99
-
100
-
101
-
102
-
103
-
104
-
105
-
106
-
107
-
108
-
109
-
110
-
111
-
112
-
113
-
114
-
115
-
116
-
117
-
118
-
119
-
120
-
121
-
122
-
123
-
124
-
125
-
126
-
127
-
128
-
129
-
130
-
131
-
132
-
133
-
134
-
135
-
136
-
137
-
138
-
139
-
140
-
141
-
142
-
143
-
144
-
145
-
146
-
147
-
148
-
149
-
150
-
151
-
152
-
153
-
154
-
155
-
156
-
157
-
158
-
159
-
160
-
161
-
162
-
163
-
164
-
165
-
166
-
167
-
168
-
169
-
170
-
171
-
172
-
173
-
174
-
175
-
176
-
177
-
178
-
179
-
180
-
181
-
182
-
183
-
184
-
185
-
186
-
187
-
188
-
189
-
190
 |
 |

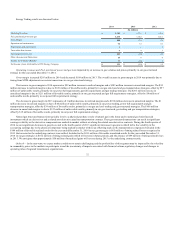
We had pension costs of $179 million in 2014, $228 million in 2013 and $220 million in 2012. Other postretirement benefit costs (credit) were $(123)
million in 2014, $(42) million in 2013 and $151 million in 2012. Pension and other postretirement benefit costs (credit) for 2014 are calculated based upon a
number of actuarial assumptions, including an expected long-term rate of return on our plan assets of 7.75% for our pension plans and 8% for our other
postretirement benefit plans. In developing our expected long-term rate of return assumptions, we evaluated asset class risk and return expectations, as well as
inflation assumptions. Projected returns are based on broad equity, bond and other markets. Our 2015 expected long-term rate of return on pension plan assets
is based on an asset allocation assumption utilizing active investment management of 47% in equity markets, 25% in fixed income markets, and 28%
invested in other assets. Because of market volatility, we periodically review our asset allocation and rebalance our portfolio when considered appropriate.
Given market conditions and financial market risk considerations, we are maintaining our long-term rate of return assumptions for our pension plans and our
other postretirement plans at 7.75% and 8%, respectively for 2015. We believe these rates are reasonable assumptions for the long-term rate of return on our
plan assets for 2015 given our investment strategy. We will continue to evaluate our actuarial assumptions, including our expected rate of return, at least
annually.
We calculate the expected return on pension and other postretirement benefit plan assets by multiplying the expected return on plan assets by the
market-related value (MRV) of plan assets at the beginning of the year, taking into consideration anticipated contributions and benefit payments that are to
be made during the year. Current accounting rules provide that the MRV of plan assets can be either fair value or a calculated value that recognizes changes
in fair value in a systematic and rational manner over not more than five years. For our pension plans, we use a calculated value when determining the MRV
of the pension plan assets and recognize changes in fair value over a three-year period. Accordingly, the future value of assets will be impacted as previously
deferred gains or losses are recognized. Financial markets in 2014 contributed to our investment performance resulting in unrecognized net gains. As of
December 31, 2014, we had $78 million of cumulative gains that remain to be recognized in the calculation of the MRV of pension assets related to
investment performance in 2014, 2013 and 2012. For our other postretirement benefit plans, we use fair value when determining the MRV of other
postretirement benefit plan assets, therefore all investment gains and losses have been recognized in the calculation of MRV for these plans.
The discount rate that we utilize for determining future pension and other postretirement benefit obligations is based on a yield curve approach and a
review of bonds that receive one of the two highest ratings given by a recognized rating agency. The yield curve approach matches projected pension plan
and other postretirement benefit payment streams with bond portfolios reflecting actual liability duration unique to our plans. The discount rate determined
on this basis decreased to 4.12% for the pension plans and 4.1% for the other postretirement plans at December 31, 2014 from 4.95% at December 31, 2013.
The mortality assumptions that we used to determine the pension and other postretirement benefit obligations as of December 31, 2014, were updated
to incorporate the RP-2014 mortality table issued by the Society of Actuaries in 2014 with the MP-2014 generational projection scale, with variations by
type of plan and participant's union status and employment status.
We estimate that our 2015 total pension costs will approximate $218 million compared to $179 million in 2014 primarily due to lower discount rates
and changes to the mortality tables, partially offset by greater than expected 2014 returns. Our 2015 other postretirement benefit credit will approximate
$(98) million compared to $(123) million in 2014 due to lower than expected returns, lower discount rate and changes to the mortality tables, partially offset
by the continued impact of plan design changes and favorable retiree medical utilization trends. Our health care trend rate for pre-65 participants assumes
7.5% for 2015, and 7% for 2016 and 2017, 6.5% for 2018, 6% in 2019, 5.75% in 2020, 5.5% in 2021, 5.25% in 2022, 5% in 2023, 4.75% in 2024, and 4.5%
in 2025 and beyond. Our health care trend rate for post-65 participants assumes 6.5% for 2015 and 6.25% for 2016 and 2017, 6% in 2018, 5.75% in 2019,
5.5% in 2020, 5.25% in 2021, 5% in 2022, 4.75% in 2023, and 4.5% in 2024 and beyond. Future actual pension and other postretirement benefit costs
(credit) will depend on future investment performance, changes in future discount rates and various other factors related to plan design.
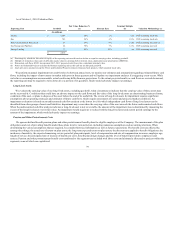
Lowering the expected long-term rate of return on our plan assets by one percentage point would have increased our 2014 pension costs by
approximately $33 million. Lowering the discount rate and the salary increase assumptions by one percentage point would have increased our 2014 pension
costs by approximately $18 million. Lowering the expected long-term rate of return on our plan assets by one percentage point would have decreased our
2014 other postretirement credit by approximately $15 million. Lowering the discount rate assumption by one percentage point would have decreased our
2014 other postretirement credit by approximately $24 million. Lowering the health care cost trend assumptions by one percentage point would have
increased our other postretirement credit for 2014 by approximately $7 million.
40