DTE Energy 2014 Annual Report Download - page 77
Download and view the complete annual report
Please find page 77 of the 2014 DTE Energy annual report below. You can navigate through the pages in the report by either clicking on the pages listed below, or by using the keyword search tool below to find specific information within the annual report.-
 1
1 -
2
-
3
-
4
-
5
-
6
-
7
-
8
-
9
-
10
-
11
-
12
-
13
-
14
-
15
-
16
-
17
-
18
-
19
-
20
-
21
-
22
-
23
-
24
-
25
-
26
-
27
-
28
-
29
-
30
-
31
-
32
-
33
-
34
-
35
-
36
-
37
-
38
-
39
-
40
-
41
-
42
-
43
-
44
-
45
-
46
-
47
-
48
-
49
-
50
-
51
-
52
-
53
-
54
-
55
-
56
-
57
-
58
-
59
-
60
-
61
-
62
-
63
-
64
-
65
-
66
-
 67
67 -
 68
68 -
 69
69 -
 70
70 -
 71
71 -
 72
72 -
 73
73 -
 74
74 -
 75
75 -
 76
76 -
 77
77 -
 78
78 -
 79
79 -
 80
80 -
 81
81 -
 82
82 -
 83
83 -
 84
84 -
 85
85 -
 86
86 -
 87
87 -
88
-
89
-
90
-
91
-
92
-
93
-
94
-
95
-
96
-
97
-
98
-
99
-
100
-
101
-
102
-
103
-
104
-
105
-
106
-
107
-
108
-
109
-
110
-
111
-
112
-
113
-
114
-
115
-
116
-
117
-
118
-
119
-
120
-
121
-
122
-
123
-
124
-
125
-
126
-
127
-
128
-
129
-
130
-
131
-
132
-
133
-
134
-
135
-
136
-
137
-
138
-
139
-
140
-
141
-
142
-
143
-
144
-
145
-
146
-
147
-
148
-
149
-
150
-
151
-
152
-
153
-
154
-
155
-
156
-
157
-
158
-
159
-
160
-
161
-
162
-
163
-
164
-
165
-
166
-
167
-
168
-
169
-
170
-
171
-
172
-
173
-
174
-
175
-
176
-
177
-
178
-
179
-
180
-
181
-
182
-
183
-
184
-
185
-
186
-
187
-
188
-
189
-
190
 |
 |

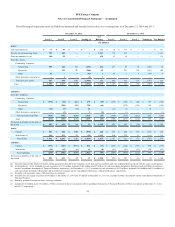
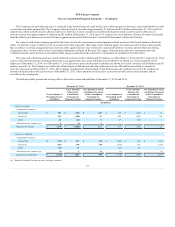
The following table presents assets and liabilities measured and recorded at fair value on a recurring basis as of December 31, 2014 and 2013:
Cash equivalents (b)
$ 10
$ 115
$ —
$ —
$ 125
Nuclear decommissioning trusts
779
412
—
—
1,191
Other investments (c) (d)
92
44
—
—
136
Derivative assets:
Commodity Contracts:
Natural Gas
273
89
34
(382)
14
Electricity
—
261
139
(291)
109
Other
33
1
3
(34)
3
Other derivative contracts (e)
—
—
—
—
—
Total derivative assets
306
351
176
(707)
126
Total
$ 1,187
$ 922
$ 176
$ (707)
$ 1,578
Derivative liabilities:
Commodity Contracts:
Natural Gas
$ (277)
$ (140)
$ (86)
$ 395
$ (108)
Electricity
—
(272)
(126)
269
(129)
Other
(32)
(2)
—
34
—
Other derivative contracts (e)
—
(1)
—
—
(1)
Total derivative liabilities
(309)
(415)
(212)
698
(238)
Total
$ (309)
$ (415)
$ (212)
$ 698
$ (238)
Net Assets (Liabilities) at the end of
the period
$ 878
$ 507
$ (36)
$ (9)
$ 1,340
Current
$ 277
$ 400
$ 139
$ (592)
$ 224
Noncurrent (f)
910
522
37
(115)
1,354
Total Assets
$ 1,187
$ 922
$ 176
$ (707)
$ 1,578
Current
$ (268)
$ (328)
$ (177)
$ 578
$ (195)
Noncurrent
(41)
(87)
(35)
120
(43)
Total Liabilities
$ (309)
$ (415)
$ (212)
$ 698
$ (238)
Net Assets (Liabilities) at the end of
the period
$ 878
$ 507
$ (36)
$ (9)
$ 1,340
_______________________________________
(a) Amounts represent the impact of master netting agreements that allow the Company to net gain and loss positions and cash collateral held or placed with the same counterparties.
(b) At December 31, 2014, available-for-sale securities of $112 million included $105 million and $7 million of cash equivalents included in Restricted cash and Other investments
on the Consolidated Statements of Financial Position, respectively. At December 31, 2013, available-for-sale securities of $125 million, included $109 million and $16 million of
cash equivalents included in Restricted cash and Other investments on the Consolidated Statements of Financial Position, respectively.
(c) Excludes cash surrender value of life insurance investments.
(d) Available-for-sale equity securities of $8 million at December 31, 2014 and $7 million at December 31, 2013 are included in Other investments on the Consolidated Statements of
Financial Position.
(e) Primarily includes Foreign currency exchange contracts.
(f) Includes $150 million and $136 million of Other investments that are included in the Consolidated Statements of Financial Position in Other investments at December 31, 2014
and 2013, respectively.
74