DTE Energy 2014 Annual Report Download - page 35
Download and view the complete annual report
Please find page 35 of the 2014 DTE Energy annual report below. You can navigate through the pages in the report by either clicking on the pages listed below, or by using the keyword search tool below to find specific information within the annual report.-
 1
1 -
2
-
3
-
4
-
5
-
6
-
7
-
8
-
9
-
10
-
11
-
12
-
13
-
14
-
15
-
16
-
17
-
18
-
19
-
20
-
21
-
22
-
23
-
24
-
 25
25 -
 26
26 -
 27
27 -
 28
28 -
 29
29 -
 30
30 -
 31
31 -
 32
32 -
 33
33 -
 34
34 -
 35
35 -
 36
36 -
 37
37 -
 38
38 -
 39
39 -
 40
40 -
 41
41 -
 42
42 -
 43
43 -
 44
44 -
 45
45 -
46
-
47
-
48
-
49
-
50
-
51
-
52
-
53
-
54
-
55
-
56
-
57
-
58
-
59
-
60
-
61
-
62
-
63
-
64
-
65
-
66
-
67
-
68
-
69
-
70
-
71
-
72
-
73
-
74
-
75
-
76
-
77
-
78
-
79
-
80
-
81
-
82
-
83
-
84
-
85
-
86
-
87
-
88
-
89
-
90
-
91
-
92
-
93
-
94
-
95
-
96
-
97
-
98
-
99
-
100
-
101
-
102
-
103
-
104
-
105
-
106
-
107
-
108
-
109
-
110
-
111
-
112
-
113
-
114
-
115
-
116
-
117
-
118
-
119
-
120
-
121
-
122
-
123
-
124
-
125
-
126
-
127
-
128
-
129
-
130
-
131
-
132
-
133
-
134
-
135
-
136
-
137
-
138
-
139
-
140
-
141
-
142
-
143
-
144
-
145
-
146
-
147
-
148
-
149
-
150
-
151
-
152
-
153
-
154
-
155
-
156
-
157
-
158
-
159
-
160
-
161
-
162
-
163
-
164
-
165
-
166
-
167
-
168
-
169
-
170
-
171
-
172
-
173
-
174
-
175
-
176
-
177
-
178
-
179
-
180
-
181
-
182
-
183
-
184
-
185
-
186
-
187
-
188
-
189
-
190
 |
 |

The Energy Trading portfolio includes financial instruments, physical commodity contracts and natural gas inventory, as well as contracted natural gas
pipeline transportation and storage, and generation capacity positions. Energy Trading also provides natural gas, power and related services, which may
include the management of associated storage and transportation contracts on the customers' behalf, and the supply or purchase of renewable energy credits
to various customers. Significant portions of the Energy Trading portfolio are economically hedged. Most financial instruments and physical power and
natural gas contracts are deemed derivatives, whereas natural gas inventory, pipeline transportation, renewable energy credits, and storage assets are not
derivatives. As a result, we will experience earnings volatility as derivatives are marked-to-market without revaluing the underlying non-derivative contracts
and assets. Our strategy is to economically manage the price risk of these underlying non-derivative contracts and assets with futures, forwards, swaps and
options. This results in gains and losses that are recognized in different interim and annual accounting periods.
See also the “Fair Value” section that follows.
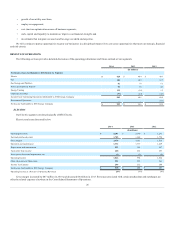
Corporate and Other includes various holding company activities and holds certain non-utility debt and energy-related investments. The 2014 net loss
of $57 million represented an increase of $13 million from the 2013 net loss of $44 million due primarily to increased impairments of investments and
increased deferred tax expense related to New York state income tax reform enacted March 31, 2014. The 2013 net loss of $44 million represented an
improvement of $3 million from the 2012 net loss of $47 million due primarily to decreased impairments of investments.
See Note 9 to the Consolidated Financial Statements in Item 8 of this Report, "Income Taxes".
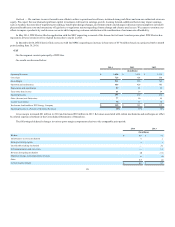
In December 2012, the Company sold its 100% equity interest in its Unconventional Gas Production business which consisted of gas and oil
production assets in the western Barnett and Marble Falls shale areas of Texas. See Note 4 to the Consolidated Financial Statements in Item 8 of this Report,
"Discontinued Operations".
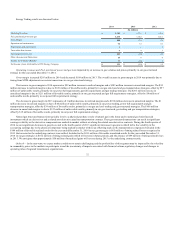
We use cash to maintain and expand our electric and natural gas utilities and to grow our non-utility businesses, retire and pay interest on long-term
debt and pay dividends. We believe that we will have sufficient internal and external capital resources to fund anticipated capital and operating
requirements. We expect that cash from operations in 2015 will be approximately $1.7 billion, or approximately $100 million lower than 2014, due primarily
to decreased surcharge collections. We anticipate base level utility capital investments, environmental, renewable and energy optimization expenditures,
expenditures for non-utility businesses and contributions to equity method investments in 2015 of approximately $2.6 billion. We plan to seek regulatory
approval to include utility capital expenditures in our regulatory rate base consistent with prior treatment. Capital spending for growth of existing or new
non-utility businesses will depend on the existence of opportunities that meet our strict risk-return and value creation criteria.
33