Electronic Arts 2004 Annual Report Download - page 101
Download and view the complete annual report
Please find page 101 of the 2004 Electronic Arts annual report below. You can navigate through the pages in the report by either clicking on the pages listed below, or by using the keyword search tool below to find specific information within the annual report.-
 1
1 -
2
-
3
-
4
-
5
-
6
-
7
-
8
-
9
-
10
-
11
-
12
-
13
-
14
-
15
-
16
-
17
-
18
-
19
-
20
-
21
-
22
-
23
-
24
-
25
-
26
-
27
-
28
-
29
-
30
-
31
-
32
-
33
-
34
-
35
-
36
-
37
-
38
-
39
-
40
-
41
-
42
-
43
-
44
-
45
-
46
-
47
-
48
-
49
-
50
-
51
-
52
-
53
-
54
-
55
-
56
-
57
-
58
-
59
-
60
-
61
-
62
-
63
-
64
-
65
-
66
-
67
-
68
-
69
-
70
-
71
-
72
-
73
-
74
-
75
-
76
-
77
-
78
-
79
-
80
-
81
-
82
-
83
-
84
-
85
-
86
-
87
-
88
-
89
-
90
-
 91
91 -
 92
92 -
 93
93 -
 94
94 -
 95
95 -
 96
96 -
 97
97 -
 98
98 -
 99
99 -
 100
100 -
 101
101 -
 102
102 -
 103
103 -
 104
104 -
 105
105 -
 106
106 -
 107
107 -
 108
108 -
 109
109 -
 110
110 -
 111
111 -
112
-
113
-
114
-
115
-
116
-
117
-
118
-
119
 |
 |

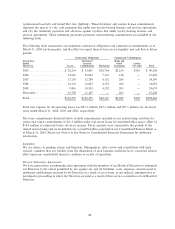
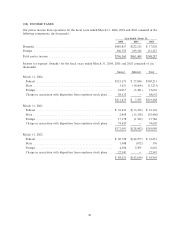
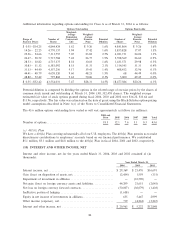
Additional information regarding options outstanding for Class A as of March 31, 2004 is as follows:
Options Outstanding Options Exercisable
Weighted-
Average Weighted- Weighted-
Remaining Average Average
Range of Number of Contractual Exercise Potential Number of Exercise Potential
Exercise Prices Shares Life Price Dilution Shares Price Dilution
$ 0.55 - $14.25 4,844,424 3.62 $ 9.26 1.6% 4,841,864 $ 9.26 1.6%
14.26 - 22.25 4,770,157 5.94 17.42 1.6% 3,855,828 17.07 1.3%
22.26 - 24.66 7,313,755 7.05 23.82 2.5% 4,021,731 24.04 1.3%
24.67 - 28.52 5,715,784 7.42 26.75 1.9% 2,598,569 26.60 0.9%
28.53 - 30.82 4,715,375 8.18 30.03 1.6% 1,431,571 29.98 0.5%
30.83 - 31.32 6,381,092 8.53 31.31 2.1% 1,314,343 31.31 0.4%
31.33 - 44.40 4,357,256 9.17 39.41 1.4% 408,412 32.96 0.1%
44.41 - 48.79 4,658,320 9.60 48.23 1.5% 68 44.49 0.0%
48.80 - 52.42 797,868 9.62 50.06 0.3% 5,000 49.45 0.0%
$ 0.55 - $52.42 43,554,031 7.47 $28.31 14.5% 18,477,386 $20.26 6.1%
Potential dilution is computed by dividing the options in the related range of exercise prices by the shares of
common stock issued and outstanding at March 31, 2004 (301,332,458 shares). The weighted average
estimated fair value of stock options granted during Ñscal 2004, 2003 and 2002 were $16.22, $13.64 and
$11.96, respectively. The fair value was estimated on the date of grant using the Black-Scholes option-pricing
model assumptions described in Note 1(o) of the Notes to Consolidated Financial Statements.
The 43.6 million options outstanding have vested or will vest approximately as follows (in millions):
2004 and
Prior 2005 2006 2007 2008 Total
Number of optionsÏÏÏÏÏÏÏÏÏÏÏÏÏÏÏÏÏÏÏÏÏÏÏÏÏÏÏÏÏÏÏÏÏÏÏ 18.5 12.1 7.6 5.1 0.3 43.6
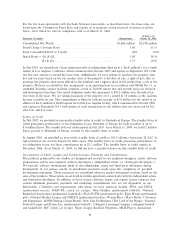
(c) 401(k) Plan
We have a 401(k) Plan covering substantially all of our U.S. employees. The 401(k) Plan permits us to make
discretionary contributions to employees' accounts based on our Ñnancial performance. We contributed
$5.1 million, $5.1 million and $4.8 million to the 401(k) Plan in Ñscal 2004, 2003 and 2002, respectively.
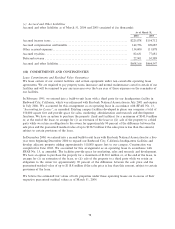
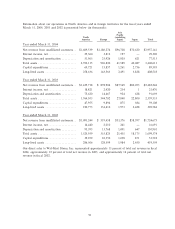
(14) INTEREST AND OTHER INCOME, NET
Interest and other income, net for the years ended March 31, 2004, 2003 and 2002 consisted of (in
thousands):
Year Ended March 31,
2004 2003 2002
Interest income, net ÏÏÏÏÏÏÏÏÏÏÏÏÏÏÏÏÏÏÏÏÏÏÏÏÏÏÏÏÏÏÏÏÏÏÏÏÏÏÏÏÏÏÏÏ $ 29,369 $ 21,476 $16,691
Gain (loss) on disposition of assets, netÏÏÏÏÏÏÏÏÏÏÏÏÏÏÏÏÏÏÏÏÏÏÏÏÏÏÏÏ (2,434) 1,559 (131)
Impairment of investment in aÇliates ÏÏÏÏÏÏÏÏÏÏÏÏÏÏÏÏÏÏÏÏÏÏÏÏÏÏÏÏÏ Ì (10,590) Ì
Net gain (loss) on foreign currency assets and liabilitiesÏÏÏÏÏÏÏÏÏÏÏÏÏÏ 44,299 21,651 (2,041)
Net loss on foreign currency forward contracts ÏÏÏÏÏÏÏÏÏÏÏÏÏÏÏÏÏÏÏÏÏÏ (50,007) (30,079) (1,403)
IneÅective portion of hedging ÏÏÏÏÏÏÏÏÏÏÏÏÏÏÏÏÏÏÏÏÏÏÏÏÏÏÏÏÏÏÏÏÏÏÏÏ (1,638) Ì Ì
Equity in net income of investments in aÇliatesÏÏÏÏÏÏÏÏÏÏÏÏÏÏÏÏÏÏÏÏÏ 655 5,467 2,999
Other income (expense), netÏÏÏÏÏÏÏÏÏÏÏÏÏÏÏÏÏÏÏÏÏÏÏÏÏÏÏÏÏÏÏÏÏÏÏÏÏ 719 (4,262) (3,267)
Interest and other income, net ÏÏÏÏÏÏÏÏÏÏÏÏÏÏÏÏÏÏÏÏÏÏÏÏÏÏÏÏÏÏÏÏÏÏÏ $ 20,963 $ 5,222 $12,848
86