Electronic Arts 2004 Annual Report Download - page 52
Download and view the complete annual report
Please find page 52 of the 2004 Electronic Arts annual report below. You can navigate through the pages in the report by either clicking on the pages listed below, or by using the keyword search tool below to find specific information within the annual report.-
 1
1 -
2
-
3
-
4
-
5
-
6
-
7
-
8
-
9
-
10
-
11
-
12
-
13
-
14
-
15
-
16
-
17
-
18
-
19
-
20
-
21
-
22
-
23
-
24
-
25
-
26
-
27
-
28
-
29
-
30
-
31
-
32
-
33
-
34
-
35
-
36
-
37
-
38
-
39
-
40
-
41
-
 42
42 -
 43
43 -
 44
44 -
 45
45 -
 46
46 -
 47
47 -
 48
48 -
 49
49 -
 50
50 -
 51
51 -
 52
52 -
 53
53 -
 54
54 -
 55
55 -
 56
56 -
 57
57 -
 58
58 -
 59
59 -
 60
60 -
 61
61 -
 62
62 -
63
-
64
-
65
-
66
-
67
-
68
-
69
-
70
-
71
-
72
-
73
-
74
-
75
-
76
-
77
-
78
-
79
-
80
-
81
-
82
-
83
-
84
-
85
-
86
-
87
-
88
-
89
-
90
-
91
-
92
-
93
-
94
-
95
-
96
-
97
-
98
-
99
-
100
-
101
-
102
-
103
-
104
-
105
-
106
-
107
-
108
-
109
-
110
-
111
-
112
-
113
-
114
-
115
-
116
-
117
-
118
-
119
 |
 |

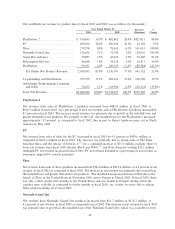
major market in which we operated during Ñscal 2003. The Nintendo GameCube was launched in Japan in
September 2001 and North America in November 2001, but not in Europe until May 2002.
Game Boy Advance
Net revenue from sales of Game Boy Advance titles increased in Ñscal 2003 by 81.2 percent to $79.1 million
as compared to $43.7 million in Ñscal 2002, primarily due to increased net revenue in the Lord of the Rings
and Harry Potter franchises and the increased number of Game Boy Advance titles available in Ñscal 2003.
In Ñscal 2003, we released seven titles on the Game Boy Advance platform compared to three in Ñscal 2002.
PlayStation
In Ñscal 2003, net revenue from PlayStation products decreased by $89.6 million to $100.0 million as
compared to Ñscal 2002. The decrease in net revenue was attributable to the market transition to newer
generation console systems and our transition away from that platform.
Co-Publishing and Distribution
Net revenue from co-publishing products and distribution products increased 39.7 percent to $375.8 million in
Ñscal 2003 compared to $269.0 million in Ñscal 2002 primarily due to strong sales of hit titles including
Kingdom Hearts, 1503 A.D. The New World and higher BattleÑeld 1942 franchise net revenue.
Advertising, Programming, Licensing and Other
In Ñscal 2003, net revenue from advertising, programming, licensing and other products decreased by
$42.5 million to $76.4 million as compared to Ñscal 2002. The decrease was primarily a result of an expected
decline in our Game Boy Color and Nintendo 64 net revenue as we transitioned away from those platforms.
In addition, revenue derived from advertising on our online games sites decreased 16 percent in Ñscal 2003
compared to the prior Ñscal year primarily due to $3.8 million in lower advertising revenue generated from
AOL and co-branded AOL online properties, and a $1.8 million decrease in online advertising purchased by
online game companies that link their games sites to ours.
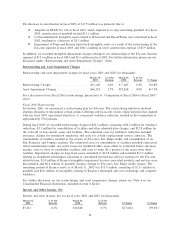
Cost of Goods Sold
Costs of goods sold for Ñscal years 2003 and 2002 (in thousands):
March 31, % of Net March 31, % of Net
2003 Revenue 2002 Revenue % Change
$1,072,802 43.2% $814,783 47.2% 31.7%
In Ñscal 2003, cost of goods sold as a percentage of net revenue decreased by 4.0 percent to 43.2 percent in
Ñscal 2003 from 47.2 percent in Ñscal 2002 primarily due to:
䡵Higher PC margins resulting from (1) higher sales of wholly-owned intellectual properties such as
SimCity 4 and Command & Conquer Generals, (2) lower developer royalties in general, and
(3) higher average sales prices of our products. Higher PC margins increased our total gross margin
by 1.7 percent.
䡵Higher margins on co-publishing and distribution products primarily due to a higher volume of co-
publishing products, which have a higher gross margin than distribution products, released in Ñscal
2003, such as BattleÑeld 1942, Ty the Tasmanian Tiger and The Simpsons Road Rage. Higher
margins on co-publishing and distribution products contributed 0.9 percent to our total gross margin.
䡵Higher margins on PlayStation 2 products primarily due to volume discounts received from Sony
and overall lower average manufacturing royalty rates, all of which contributed 0.8 percent to our
total gross margin.
37