Electronic Arts 2004 Annual Report Download - page 102
Download and view the complete annual report
Please find page 102 of the 2004 Electronic Arts annual report below. You can navigate through the pages in the report by either clicking on the pages listed below, or by using the keyword search tool below to find specific information within the annual report.-
 1
1 -
2
-
3
-
4
-
5
-
6
-
7
-
8
-
9
-
10
-
11
-
12
-
13
-
14
-
15
-
16
-
17
-
18
-
19
-
20
-
21
-
22
-
23
-
24
-
25
-
26
-
27
-
28
-
29
-
30
-
31
-
32
-
33
-
34
-
35
-
36
-
37
-
38
-
39
-
40
-
41
-
42
-
43
-
44
-
45
-
46
-
47
-
48
-
49
-
50
-
51
-
52
-
53
-
54
-
55
-
56
-
57
-
58
-
59
-
60
-
61
-
62
-
63
-
64
-
65
-
66
-
67
-
68
-
69
-
70
-
71
-
72
-
73
-
74
-
75
-
76
-
77
-
78
-
79
-
80
-
81
-
82
-
83
-
84
-
85
-
86
-
87
-
88
-
89
-
90
-
91
-
 92
92 -
 93
93 -
 94
94 -
 95
95 -
 96
96 -
 97
97 -
 98
98 -
 99
99 -
 100
100 -
 101
101 -
 102
102 -
 103
103 -
 104
104 -
 105
105 -
 106
106 -
 107
107 -
 108
108 -
 109
109 -
 110
110 -
 111
111 -
 112
112 -
113
-
114
-
115
-
116
-
117
-
118
-
119
 |
 |

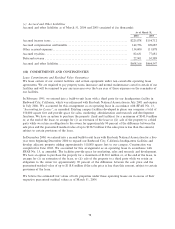
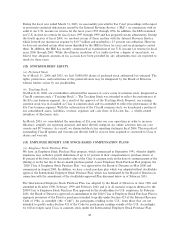
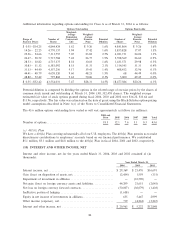
(15) COMPREHENSIVE INCOME
SFAS No. 130, ""Reporting Comprehensive Income'', requires classiÑcation of other comprehensive income in
a Ñnancial statement and display of other comprehensive income separately from retained earnings and
additional paid-in capital. Other comprehensive income includes primarily foreign currency translation
adjustments and unrealized gains (losses) on investments.
The change in the components of accumulated other comprehensive income, net of tax, is summarized as
follows (in thousands):
Unrealized
Foreign Gains Accumulated
Currency (Losses) on Other
Translation Investments, Comprehensive
Adjustment Net Income (Loss)
Balance at March 31, 2001 ÏÏÏÏÏÏÏÏÏÏÏÏÏÏÏÏÏÏÏÏÏÏÏÏÏÏÏÏÏÏÏÏÏ $(15,619) $ 2,916 $(12,703)
Other comprehensive income (loss)ÏÏÏÏÏÏÏÏÏÏÏÏÏÏÏÏÏÏÏÏÏÏÏÏÏÏ 1,453 (3,474) (2,021)
Balance at March 31, 2002 ÏÏÏÏÏÏÏÏÏÏÏÏÏÏÏÏÏÏÏÏÏÏÏÏÏÏÏÏÏÏÏÏÏ (14,166) (558) (14,724)
Other comprehensive income ÏÏÏÏÏÏÏÏÏÏÏÏÏÏÏÏÏÏÏÏÏÏÏÏÏÏÏÏÏÏÏ 14,540 1,718 16,258
Balance at March 31, 2003 ÏÏÏÏÏÏÏÏÏÏÏÏÏÏÏÏÏÏÏÏÏÏÏÏÏÏÏÏÏÏÏÏÏ 374 1,160 1,534
Other comprehensive income (loss)ÏÏÏÏÏÏÏÏÏÏÏÏÏÏÏÏÏÏÏÏÏÏÏÏÏÏ 19,134 (189) 18,945
Balance at March 31, 2004 ÏÏÏÏÏÏÏÏÏÏÏÏÏÏÏÏÏÏÏÏÏÏÏÏÏÏÏÏÏÏÏÏÏ $ 19,508 $ 971 $ 20,479
The change in unrealized gains (losses) on investments, net are shown net of taxes of $0.1 million,
$1.3 million and $(1.6) million in Ñscal 2004, 2003 and 2002, respectively.
The foreign currency translation adjustments are not adjusted for income taxes as they relate to indeÑnite
investments in non-U.S. subsidiaries.
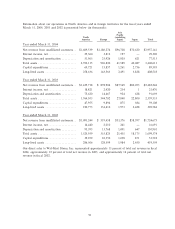
(16) NET INCOME (LOSS) PER SHARE
The following summarizes the computations of Basic Earnings Per Share (""EPS'') and Diluted EPS. Basic
EPS is computed as net earnings divided by the weighted-average number of common shares outstanding for
the period. Diluted EPS reÖects the potential dilution that could occur from common shares issuable
through stock-based compensation plans including stock options, restricted stock awards, warrants and other
convertible securities using the treasury stock method.
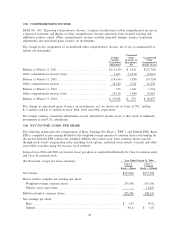
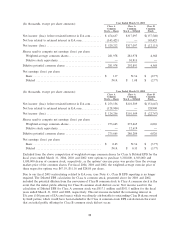
In Ñscal years 2003 and 2002, net income (loss) per share is computed individually for Class A common stock
and Class B common stock.
Year Ended March 31, 2004
(In thousands, except per share amounts): Class A Class A
Common Common
Stock Ì Basic Stock Ì Diluted
Net income ÏÏÏÏÏÏÏÏÏÏÏÏÏÏÏÏÏÏÏÏÏÏÏÏÏÏÏÏÏÏÏÏÏÏÏÏÏÏÏÏÏÏÏÏÏÏÏÏÏÏÏÏÏÏ $577,292 $577,292
Shares used to compute net earnings per share:
Weighted-average common shares ÏÏÏÏÏÏÏÏÏÏÏÏÏÏÏÏÏÏÏÏÏÏÏÏÏÏÏÏÏÏÏÏÏ 295,396 295,396
Dilutive stock equivalents ÏÏÏÏÏÏÏÏÏÏÏÏÏÏÏÏÏÏÏÏÏÏÏÏÏÏÏÏÏÏÏÏÏÏÏÏÏÏÏÏ Ì 12,837
Dilutive potential common sharesÏÏÏÏÏÏÏÏÏÏÏÏÏÏÏÏÏÏÏÏÏÏÏÏÏÏÏÏÏÏÏÏÏÏÏÏ 295,396 308,233
Net earnings per share:
BasicÏÏÏÏÏÏÏÏÏÏÏÏÏÏÏÏÏÏÏÏÏÏÏÏÏÏÏÏÏÏÏÏÏÏÏÏÏÏÏÏÏÏÏÏÏÏÏÏÏÏÏÏÏÏÏÏÏÏ $ 1.95 N/A
Diluted ÏÏÏÏÏÏÏÏÏÏÏÏÏÏÏÏÏÏÏÏÏÏÏÏÏÏÏÏÏÏÏÏÏÏÏÏÏÏÏÏÏÏÏÏÏÏÏÏÏÏÏÏÏÏÏÏ N/A $ 1.87
87