Electronic Arts 2004 Annual Report Download - page 43
Download and view the complete annual report
Please find page 43 of the 2004 Electronic Arts annual report below. You can navigate through the pages in the report by either clicking on the pages listed below, or by using the keyword search tool below to find specific information within the annual report.-
 1
1 -
2
-
3
-
4
-
5
-
6
-
7
-
8
-
9
-
10
-
11
-
12
-
13
-
14
-
15
-
16
-
17
-
18
-
19
-
20
-
21
-
22
-
23
-
24
-
25
-
26
-
27
-
28
-
29
-
30
-
31
-
32
-
 33
33 -
 34
34 -
 35
35 -
 36
36 -
 37
37 -
 38
38 -
 39
39 -
 40
40 -
 41
41 -
 42
42 -
 43
43 -
 44
44 -
 45
45 -
 46
46 -
 47
47 -
 48
48 -
 49
49 -
 50
50 -
 51
51 -
 52
52 -
 53
53 -
54
-
55
-
56
-
57
-
58
-
59
-
60
-
61
-
62
-
63
-
64
-
65
-
66
-
67
-
68
-
69
-
70
-
71
-
72
-
73
-
74
-
75
-
76
-
77
-
78
-
79
-
80
-
81
-
82
-
83
-
84
-
85
-
86
-
87
-
88
-
89
-
90
-
91
-
92
-
93
-
94
-
95
-
96
-
97
-
98
-
99
-
100
-
101
-
102
-
103
-
104
-
105
-
106
-
107
-
108
-
109
-
110
-
111
-
112
-
113
-
114
-
115
-
116
-
117
-
118
-
119
 |
 |

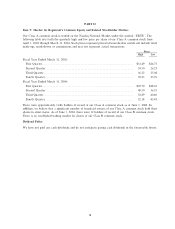
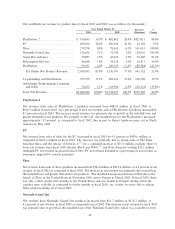
PlayStation
In Ñscal 2004, net revenue from PlayStation products decreased by $70.3 million to $29.6 million as compared
to Ñscal 2003. We anticipated the decline in net revenue from PlayStation products as we continued to
transition away from that platform. Although our PlayStation products are playable on the PlayStation 2
console, we expect sales of current PlayStation products to continue to decline in the future.
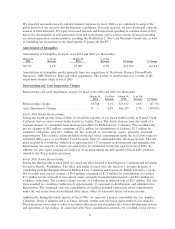
Co-Publishing and Distribution
In Ñscal 2004, net revenue from co-publishing and distribution products increased by $22.5 million to
$398.2 million as compared to Ñscal 2003. The increase was due to a $74.5 million increase in Europe
primarily from increased sales in the Final Fantasy, Freedom Fighters and BattleÑeld franchises, partially
oÅset by a decline in the Kingdom Hearts franchise in North America. Although co-publishing and
distribution net revenue increased, it declined as a percentage of net revenue.
Advertising, Programming, Licensing and Other
In Ñscal 2004, net revenue from advertising, programming, licensing and other products decreased by
$42.6 million to $33.8 million as compared to Ñscal 2003. The decrease was a result of expected declines in our
advertising and programming net revenue following our renegotiation of the terms of our relationship with
AOL during the three months ended June 30, 2003 and an expected decline in our Game Boy Color net
revenue as we transitioned away from that platform.
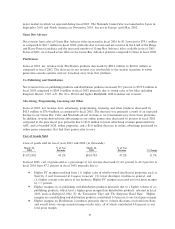
Operations by Segment
In March 2003, we consolidated the operations of the EA.com business segment into our core business. We
now consider online capability and gameplay to be integral to our existing and future products. Accordingly,
beginning April 1, 2003, we no longer manage our online products and services as a separate business
segment, and we have consolidated the reporting related to our online products and services into reporting for
the overall development and publication of our core products for all reporting periods ending after that date.
We believe that this will better reÖect the way in which our Chief Executive OÇcer (our chief operating
decision maker) reviews and manages our business and reÖects the importance of our online products and
services relative to the rest of our business. Concurrently, we have also eliminated separate reporting for our
Class B common stock for all reporting periods ending after April 1, 2003. Fiscal 2003 and 2002 have been
restated to conform with our Ñscal 2004 presentation. See Note 18 of the Notes to Consolidated Financial
Statements, included in Item 8 hereof.
Our view and reporting of business segments may change due to changes in underlying business facts and
circumstances and the evolution of our reporting to our Chief Executive OÇcer.
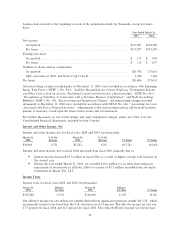
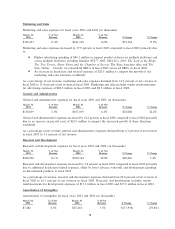
Cost of Goods Sold
Cost of goods sold for our disk-based and cartridge-based products consists of (1) product costs, (2) certain
royalty expenses for celebrities, professional sports and other organizations and independent software
developers, (3) manufacturing royalties, net of volume discounts, (4) expenses for defective products,
(5) write-oÅ of post-launch prepaid royalty costs, and (6) operations expenses. Cost of goods sold for our
online product subscription business consists primarily of data center and bandwidth costs associated with
hosting our websites, credit card fees and royalties for use of third party properties. Cost of goods sold for our
website advertising business primarily consists of ad serving costs.
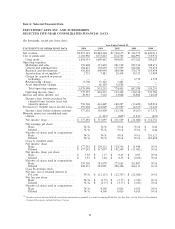
Costs of goods sold for Ñscal years 2004 and 2003 (in thousands):
March 31, % of Net March 31, % of Net
2004 Revenue 2003 Revenue % Change
$1,102,950 37.3% $1,072,802 43.2% 2.8%
28