Electronic Arts 2004 Annual Report Download - page 79
Download and view the complete annual report
Please find page 79 of the 2004 Electronic Arts annual report below. You can navigate through the pages in the report by either clicking on the pages listed below, or by using the keyword search tool below to find specific information within the annual report.-
 1
1 -
2
-
3
-
4
-
5
-
6
-
7
-
8
-
9
-
10
-
11
-
12
-
13
-
14
-
15
-
16
-
17
-
18
-
19
-
20
-
21
-
22
-
23
-
24
-
25
-
26
-
27
-
28
-
29
-
30
-
31
-
32
-
33
-
34
-
35
-
36
-
37
-
38
-
39
-
40
-
41
-
42
-
43
-
44
-
45
-
46
-
47
-
48
-
49
-
50
-
51
-
52
-
53
-
54
-
55
-
56
-
57
-
58
-
59
-
60
-
61
-
62
-
63
-
64
-
65
-
66
-
67
-
68
-
 69
69 -
 70
70 -
 71
71 -
 72
72 -
 73
73 -
 74
74 -
 75
75 -
 76
76 -
 77
77 -
 78
78 -
 79
79 -
 80
80 -
 81
81 -
 82
82 -
 83
83 -
 84
84 -
 85
85 -
 86
86 -
 87
87 -
 88
88 -
 89
89 -
90
-
91
-
92
-
93
-
94
-
95
-
96
-
97
-
98
-
99
-
100
-
101
-
102
-
103
-
104
-
105
-
106
-
107
-
108
-
109
-
110
-
111
-
112
-
113
-
114
-
115
-
116
-
117
-
118
-
119
 |
 |

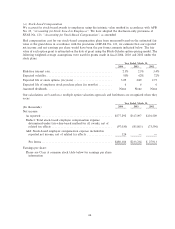
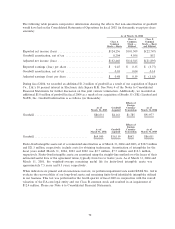
(o) Stock-based Compensation
We account for stock-based awards to employees using the intrinsic value method in accordance with APB
No. 25, ""Accounting for Stock Issued to Employees''. We have adopted the disclosure-only provisions of
SFAS No. 123, ""Accounting for Stock-Based Compensation'', as amended.
Had compensation cost for our stock-based compensation plans been measured based on the estimated fair
value at the grant dates in accordance with the provisions of SFAS No. 123, we estimate that our reported
net income and net earnings per share would have been the pro forma amounts indicated below. The fair
value of each option grant is estimated on the date of grant using the Black-Scholes option-pricing model. The
following weighted-average assumptions were used for grants made in Ñscal 2004, 2003 and 2002 under the
stock plans:
Year Ended March 31,
2004 2003 2002
Risk-free interest rateÏÏÏÏÏÏÏÏÏÏÏÏÏÏÏÏÏÏÏÏÏÏÏÏÏÏÏÏÏÏÏÏÏÏÏÏÏÏÏÏÏÏ 2.3% 2.3% 3.4%
Expected volatilityÏÏÏÏÏÏÏÏÏÏÏÏÏÏÏÏÏÏÏÏÏÏÏÏÏÏÏÏÏÏÏÏÏÏÏÏÏÏÏÏÏÏÏÏÏ 50% 62% 72%
Expected life of stock options (in years) ÏÏÏÏÏÏÏÏÏÏÏÏÏÏÏÏÏÏÏÏÏÏÏÏÏÏ 3.09 2.89 2.75
Expected life of employee stock purchase plans (in months) ÏÏÏÏÏÏÏÏÏ 6 6 6
Assumed dividends ÏÏÏÏÏÏÏÏÏÏÏÏÏÏÏÏÏÏÏÏÏÏÏÏÏÏÏÏÏÏÏÏÏÏÏÏÏÏÏÏÏÏÏÏ None None None
Our calculations are based on a multiple option valuation approach and forfeitures are recognized when they
occur.
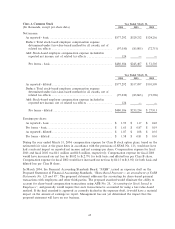
Year Ended March 31,
2004 2003 2002
(In thousands)
Net income:
As reported ÏÏÏÏÏÏÏÏÏÏÏÏÏÏÏÏÏÏÏÏÏÏÏÏÏÏÏÏÏÏÏÏÏÏÏÏÏÏÏÏÏÏÏÏÏÏÏÏ $577,292 $317,097 $101,509
Deduct: Total stock-based employee compensation expense
determined under fair-value-based method for all awards, net of
related tax eÅects ÏÏÏÏÏÏÏÏÏÏÏÏÏÏÏÏÏÏÏÏÏÏÏÏÏÏÏÏÏÏÏÏÏÏÏÏÏÏÏÏÏ (97,030) (83,863) (73,596)
Add: Stock-based employee compensation expense included in
reported net income, net of related tax eÅects ÏÏÏÏÏÏÏÏÏÏÏÏÏÏÏÏÏ 124 Ì Ì
Pro formaÏÏÏÏÏÏÏÏÏÏÏÏÏÏÏÏÏÏÏÏÏÏÏÏÏÏÏÏÏÏÏÏÏÏÏÏÏÏÏÏÏÏÏÏÏÏÏÏ $480,386 $233,234 $ 27,913
Earnings per share:
Please see Class A common stock table below for earnings per share
information
64