Electronic Arts 2004 Annual Report Download - page 106
Download and view the complete annual report
Please find page 106 of the 2004 Electronic Arts annual report below. You can navigate through the pages in the report by either clicking on the pages listed below, or by using the keyword search tool below to find specific information within the annual report.-
 1
1 -
2
-
3
-
4
-
5
-
6
-
7
-
8
-
9
-
10
-
11
-
12
-
13
-
14
-
15
-
16
-
17
-
18
-
19
-
20
-
21
-
22
-
23
-
24
-
25
-
26
-
27
-
28
-
29
-
30
-
31
-
32
-
33
-
34
-
35
-
36
-
37
-
38
-
39
-
40
-
41
-
42
-
43
-
44
-
45
-
46
-
47
-
48
-
49
-
50
-
51
-
52
-
53
-
54
-
55
-
56
-
57
-
58
-
59
-
60
-
61
-
62
-
63
-
64
-
65
-
66
-
67
-
68
-
69
-
70
-
71
-
72
-
73
-
74
-
75
-
76
-
77
-
78
-
79
-
80
-
81
-
82
-
83
-
84
-
85
-
86
-
87
-
88
-
89
-
90
-
91
-
92
-
93
-
94
-
95
-
 96
96 -
 97
97 -
 98
98 -
 99
99 -
 100
100 -
 101
101 -
 102
102 -
 103
103 -
 104
104 -
 105
105 -
 106
106 -
 107
107 -
 108
108 -
 109
109 -
 110
110 -
 111
111 -
 112
112 -
 113
113 -
 114
114 -
 115
115 -
 116
116 -
117
-
118
-
119
 |
 |

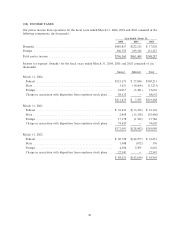
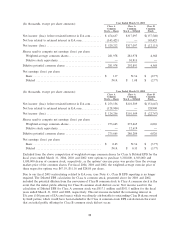
Information about our operations in North America and in foreign territories for the Ñscal years ended
March 31, 2004, 2003 and 2002 is presented below (in thousands):
Asia
PaciÑc
North (excluding
America Europe Japan) Japan Total
Year ended March 31, 2004
Net revenue from unaÇliated customersÏÏ $1,609,539 $1,180,274 $96,708 $70,620 $2,957,141
Interest income, net ÏÏÏÏÏÏÏÏÏÏÏÏÏÏÏÏÏÏÏ 25,360 3,812 197 Ì 29,369
Depreciation and amortization ÏÏÏÏÏÏÏÏÏÏ 51,963 23,926 1,003 621 77,513
Total assets ÏÏÏÏÏÏÏÏÏÏÏÏÏÏÏÏÏÏÏÏÏÏÏÏÏÏ 2,392,115 926,820 41,589 40,087 3,400,611
Capital expendituresÏÏÏÏÏÏÏÏÏÏÏÏÏÏÏÏÏÏÏ 69,721 15,857 1,261 2,756 89,595
Long-lived assets ÏÏÏÏÏÏÏÏÏÏÏÏÏÏÏÏÏÏÏÏÏ 258,636 143,563 2,491 3,828 408,518
Year ended March 31, 2003
Net revenue from unaÇliated customersÏÏ $1,435,718 $ 878,904 $87,569 $80,053 $2,482,244
Interest income, net ÏÏÏÏÏÏÏÏÏÏÏÏÏÏÏÏÏÏÏ 18,821 2,420 234 1 21,476
Depreciation and amortization ÏÏÏÏÏÏÏÏÏÏ 75,620 14,467 924 628 91,639
Total assets ÏÏÏÏÏÏÏÏÏÏÏÏÏÏÏÏÏÏÏÏÏÏÏÏÏÏ 1,764,103 544,782 27,848 22,800 2,359,533
Capital expendituresÏÏÏÏÏÏÏÏÏÏÏÏÏÏÏÏÏÏÏ 47,955 9,894 875 384 59,108
Long-lived assets ÏÏÏÏÏÏÏÏÏÏÏÏÏÏÏÏÏÏÏÏÏ 230,773 134,410 1,973 2,428 369,584
Year ended March 31, 2002
Net revenue from unaÇliated customersÏÏ $1,093,244 $ 519,458 $53,376 $58,597 $1,724,675
Interest income, net ÏÏÏÏÏÏÏÏÏÏÏÏÏÏÏÏÏÏÏ 14,440 2,010 241 Ì 16,691
Depreciation and amortization ÏÏÏÏÏÏÏÏÏÏ 95,395 13,768 1,091 647 110,901
Total assets ÏÏÏÏÏÏÏÏÏÏÏÏÏÏÏÏÏÏÏÏÏÏÏÏÏÏ 1,325,939 333,825 21,435 18,175 1,699,374
Capital expendituresÏÏÏÏÏÏÏÏÏÏÏÏÏÏÏÏÏÏÏ 39,259 10,350 1,038 871 51,518
Long-lived assets ÏÏÏÏÏÏÏÏÏÏÏÏÏÏÏÏÏÏÏÏÏ 286,306 128,599 1,984 2,450 419,339
Our direct sales to Wal-Mart Stores, Inc. represented approximately 13 percent of total net revenue in Ñscal
2004, approximately 12 percent of total net revenue in 2003, and approximately 14 percent of total net
revenue in Ñscal 2002.
91