Electronic Arts 2004 Annual Report Download - page 34
Download and view the complete annual report
Please find page 34 of the 2004 Electronic Arts annual report below. You can navigate through the pages in the report by either clicking on the pages listed below, or by using the keyword search tool below to find specific information within the annual report.-
 1
1 -
2
-
3
-
4
-
5
-
6
-
7
-
8
-
9
-
10
-
11
-
12
-
13
-
14
-
15
-
16
-
17
-
18
-
19
-
20
-
21
-
22
-
23
-
 24
24 -
 25
25 -
 26
26 -
 27
27 -
 28
28 -
 29
29 -
 30
30 -
 31
31 -
 32
32 -
 33
33 -
 34
34 -
 35
35 -
 36
36 -
 37
37 -
 38
38 -
 39
39 -
 40
40 -
 41
41 -
 42
42 -
 43
43 -
 44
44 -
45
-
46
-
47
-
48
-
49
-
50
-
51
-
52
-
53
-
54
-
55
-
56
-
57
-
58
-
59
-
60
-
61
-
62
-
63
-
64
-
65
-
66
-
67
-
68
-
69
-
70
-
71
-
72
-
73
-
74
-
75
-
76
-
77
-
78
-
79
-
80
-
81
-
82
-
83
-
84
-
85
-
86
-
87
-
88
-
89
-
90
-
91
-
92
-
93
-
94
-
95
-
96
-
97
-
98
-
99
-
100
-
101
-
102
-
103
-
104
-
105
-
106
-
107
-
108
-
109
-
110
-
111
-
112
-
113
-
114
-
115
-
116
-
117
-
118
-
119
 |
 |

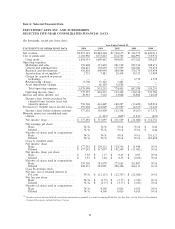
Item 6: Selected Financial Data
ELECTRONIC ARTS INC. AND SUBSIDIARIES
SELECTED FIVE-YEAR CONSOLIDATED FINANCIAL DATA
(In thousands, except per share data)
Year Ended March 31,
STATEMENTS OF OPERATIONS DATA 2004 2003 2002 2001 2000
Net revenue ÏÏÏÏÏÏÏÏÏÏÏÏÏÏÏÏÏÏÏÏÏÏÏÏÏÏ $2,957,141 $2,482,244 $1,724,675 $1,322,273 $1,420,011
Cost of goods sold ÏÏÏÏÏÏÏÏÏÏÏÏÏÏÏÏÏÏÏÏÏ 1,102,950 1,072,802 814,783 664,991 710,974
Gross proÑtÏÏÏÏÏÏÏÏÏÏÏÏÏÏÏÏÏÏÏÏÏÏÏÏÏ 1,854,191 1,409,442 909,892 657,282 709,037
Operating expenses:
Marketing and sales ÏÏÏÏÏÏÏÏÏÏÏÏÏÏÏÏÏ 370,468 332,453 241,109 185,336 188,611
General and administrativeÏÏÏÏÏÏÏÏÏÏÏÏ 184,825 130,859 107,059 104,041 92,418
Research and development ÏÏÏÏÏÏÏÏÏÏÏÏ 510,858 400,990 380,564 376,179 255,694
Amortization of intangibles(1)ÏÏÏÏÏÏÏÏÏÏ 2,735 7,482 25,418 19,323 11,989
Charge for acquired in-process
technologyÏÏÏÏÏÏÏÏÏÏÏÏÏÏÏÏÏÏÏÏÏÏÏÏ Ì Ì Ì 2,719 6,539
Restructuring charges ÏÏÏÏÏÏÏÏÏÏÏÏÏÏÏÏ 9,708 15,102 7,485 Ì Ì
Asset impairment chargesÏÏÏÏÏÏÏÏÏÏÏÏÏ Ì 66,329 12,818 Ì Ì
Total operating expensesÏÏÏÏÏÏÏÏÏÏÏÏ 1,078,594 953,215 774,453 687,598 555,251
Operating income (loss)ÏÏÏÏÏÏÏÏÏÏÏÏÏÏ 775,597 456,227 135,439 (30,316) 153,786
Interest and other income, net ÏÏÏÏÏÏÏÏÏÏÏ 20,963 5,222 12,848 16,886 16,028
Income (loss) before provision for
(beneÑt from) income taxes and
minority interestÏÏÏÏÏÏÏÏÏÏÏÏÏÏÏÏÏÏÏ 796,560 461,449 148,287 (13,430) 169,814
Provision for (beneÑt from) income taxes 219,268 143,049 45,969 (4,163) 52,642
Income (loss) before minority interest ÏÏ 577,292 318,400 102,318 (9,267) 117,172
Minority interest in consolidated joint
venture ÏÏÏÏÏÏÏÏÏÏÏÏÏÏÏÏÏÏÏÏÏÏÏÏÏÏÏÏ Ì (1,303) (809) (1,815) (421)
Net income (loss) ÏÏÏÏÏÏÏÏÏÏÏÏÏÏÏÏÏÏÏ $ 577,292 $ 317,097 $ 101,509 $ (11,082) $ 116,751
Net earnings per share:
Basic ÏÏÏÏÏÏÏÏÏÏÏÏÏÏÏÏÏÏÏÏÏÏÏÏÏÏÏÏ N/A N/A N/A N/A $ 0.46
Diluted ÏÏÏÏÏÏÏÏÏÏÏÏÏÏÏÏÏÏÏÏÏÏÏÏÏÏ N/A N/A N/A N/A $ 0.44
Number of shares used in computation:
Basic ÏÏÏÏÏÏÏÏÏÏÏÏÏÏÏÏÏÏÏÏÏÏÏÏÏÏÏÏ N/A N/A N/A N/A 251,321
Diluted ÏÏÏÏÏÏÏÏÏÏÏÏÏÏÏÏÏÏÏÏÏÏÏÏÏÏ N/A N/A N/A N/A 265,484
Class A common stock:
Net income (loss):
Basic ÏÏÏÏÏÏÏÏÏÏÏÏÏÏÏÏÏÏÏÏÏÏÏÏÏÏÏÏ $ 577,292 $ 329,212 $ 124,256 $ 11,944 N/A
Diluted ÏÏÏÏÏÏÏÏÏÏÏÏÏÏÏÏÏÏÏÏÏÏÏÏÏÏ $ 577,292 $ 317,097 $ 101,509 $ (11,082) N/A
Net income (loss) per share:
Basic ÏÏÏÏÏÏÏÏÏÏÏÏÏÏÏÏÏÏÏÏÏÏÏÏÏÏÏÏ $ 1.95 $ 1.17 $ 0.45 $ 0.05 N/A
Diluted ÏÏÏÏÏÏÏÏÏÏÏÏÏÏÏÏÏÏÏÏÏÏÏÏÏÏ $ 1.87 $ 1.08 $ 0.35 $ (0.04) N/A
Number of shares used in computation:
Basic ÏÏÏÏÏÏÏÏÏÏÏÏÏÏÏÏÏÏÏÏÏÏÏÏÏÏÏÏ 295,396 281,978 273,665 262,807 N/A
Diluted ÏÏÏÏÏÏÏÏÏÏÏÏÏÏÏÏÏÏÏÏÏÏÏÏÏÏ 308,233 292,891 286,284 264,111 N/A
Class B common stock:
Net loss, net of retained interest in
EA.comÏÏÏÏÏÏÏÏÏÏÏÏÏÏÏÏÏÏÏÏÏÏÏÏÏÏ N/A $ (12,115) $ (22,747) $ (23,026) N/A
Net loss per share:
Basic ÏÏÏÏÏÏÏÏÏÏÏÏÏÏÏÏÏÏÏÏÏÏÏÏÏÏÏÏ N/A $ (2.77) $ (3.77) $ (3.83) N/A
Diluted ÏÏÏÏÏÏÏÏÏÏÏÏÏÏÏÏÏÏÏÏÏÏÏÏÏÏ N/A $ (2.77) $ (3.77) $ (3.83) N/A
Number of shares used in computation:
Basic ÏÏÏÏÏÏÏÏÏÏÏÏÏÏÏÏÏÏÏÏÏÏÏÏÏÏÏÏ N/A 4,368 6,026 6,015 N/A
Diluted ÏÏÏÏÏÏÏÏÏÏÏÏÏÏÏÏÏÏÏÏÏÏÏÏÏÏ N/A 4,368 6,026 6,015 N/A
(1) Results for Ñscal 2004 and 2003 do not include amortization of goodwill as a result of adopting SFAS No. 142. See Note 5 of the Notes to Consolidated
Financial Statements, included in Item 8 hereof.
19