Electronic Arts 2004 Annual Report Download - page 45
Download and view the complete annual report
Please find page 45 of the 2004 Electronic Arts annual report below. You can navigate through the pages in the report by either clicking on the pages listed below, or by using the keyword search tool below to find specific information within the annual report.-
 1
1 -
2
-
3
-
4
-
5
-
6
-
7
-
8
-
9
-
10
-
11
-
12
-
13
-
14
-
15
-
16
-
17
-
18
-
19
-
20
-
21
-
22
-
23
-
24
-
25
-
26
-
27
-
28
-
29
-
30
-
31
-
32
-
33
-
34
-
 35
35 -
 36
36 -
 37
37 -
 38
38 -
 39
39 -
 40
40 -
 41
41 -
 42
42 -
 43
43 -
 44
44 -
 45
45 -
 46
46 -
 47
47 -
 48
48 -
 49
49 -
 50
50 -
 51
51 -
 52
52 -
 53
53 -
 54
54 -
 55
55 -
56
-
57
-
58
-
59
-
60
-
61
-
62
-
63
-
64
-
65
-
66
-
67
-
68
-
69
-
70
-
71
-
72
-
73
-
74
-
75
-
76
-
77
-
78
-
79
-
80
-
81
-
82
-
83
-
84
-
85
-
86
-
87
-
88
-
89
-
90
-
91
-
92
-
93
-
94
-
95
-
96
-
97
-
98
-
99
-
100
-
101
-
102
-
103
-
104
-
105
-
106
-
107
-
108
-
109
-
110
-
111
-
112
-
113
-
114
-
115
-
116
-
117
-
118
-
119
 |
 |

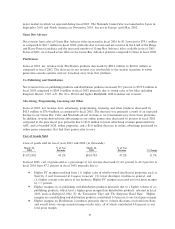
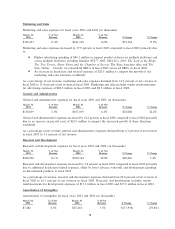
As a percentage of net revenue, marketing and sales expenses declined from 13.4 percent in Ñscal 2003 to
12.5 percent in Ñscal 2004. Marketing and sales expenses included vendor reimbursements for advertising
expenses of $44.8 million in Ñscal 2004 and $28.2 million in Ñscal 2003.
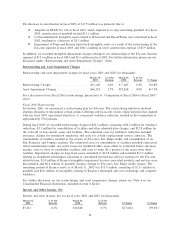
General and Administrative
General and administrative expenses consist of personnel and related expenses of executive and administrative
staÅ, fees for professional services such as legal and accounting, and allowances for bad debts.
General and administrative expenses for Ñscal years 2004 and 2003 (in thousands):
March 31, % of Net March 31, % of Net
2004 Revenue 2003 Revenue $ Change % Change
$184,825 6.3% $130,859 5.3% $53,966 41.2%
General and administrative expenses increased by 41.2 percent, or 1.0 percent of net revenue, in Ñscal 2004
compared to Ñscal 2003 primarily due to:
䡵An increase in depreciation expense of approximately $17.8 million primarily due to accelerated
depreciation on equipment and software that are being replaced and to write-oÅ assets that have
been taken out of service.
䡵An increase of approximately 9 percent, or $14.8 million, in personnel-related costs to support the
continued growth of our business.
䡵An increase in contributions of $8.5 million as we invest in our strategic university relationships.
䡵An increase of approximately $11.5 million in professional services.
䡵An increase of approximately $9.6 million in information technology and facilities expenses.
The increase in general and administrative expenses was partially oÅset by a decrease in bad debt expense of
$9.1 million, primarily as a result of collecting on accounts that we had previously deemed uncollectible.
Research and Development
Research and development expenses consist of expenses incurred by our production studios for personnel-
related costs, consulting, equipment depreciation and any impairment of prepaid royalties for pre-launch
products. Research and development expenses for our online business include expenses incurred by our studios
consisting of direct development costs and related overhead costs in connection with the development and
production of our online games. Research and development expenses also include expenses associated with
development of website content, network infrastructure direct expenses, software licenses and maintenance,
and network and management overhead.
Research and development expenses for Ñscal years 2004 and 2003 (in thousands):
March 31, % of Net March 31, % of Net
2004 Revenue 2003 Revenue $ Change % Change
$510,858 17.3% $400,990 16.1% $109,868 27.4%
Research and development expenses increased by 27.4 percent, or 1.2 percentage points of net revenue, in
Ñscal 2004 compared to Ñscal 2003 primarily due to:
䡵Increases in personnel-related costs of $100.8 million of which approximately $64.3 million resulted
from a 22.2 percent increase in average regular full-time employee headcount.
䡵An overall increase in external development expenses of $23.4 million related to development of new
products.
The increase in research and development expenses was partially oÅset by a decrease in depreciation and other
operating expenses due to asset impairments recognized in the third and fourth quarters of Ñscal 2003.
30