Electronic Arts 2004 Annual Report Download - page 53
Download and view the complete annual report
Please find page 53 of the 2004 Electronic Arts annual report below. You can navigate through the pages in the report by either clicking on the pages listed below, or by using the keyword search tool below to find specific information within the annual report.-
 1
1 -
2
-
3
-
4
-
5
-
6
-
7
-
8
-
9
-
10
-
11
-
12
-
13
-
14
-
15
-
16
-
17
-
18
-
19
-
20
-
21
-
22
-
23
-
24
-
25
-
26
-
27
-
28
-
29
-
30
-
31
-
32
-
33
-
34
-
35
-
36
-
37
-
38
-
39
-
40
-
41
-
42
-
 43
43 -
 44
44 -
 45
45 -
 46
46 -
 47
47 -
 48
48 -
 49
49 -
 50
50 -
 51
51 -
 52
52 -
 53
53 -
 54
54 -
 55
55 -
 56
56 -
 57
57 -
 58
58 -
 59
59 -
 60
60 -
 61
61 -
 62
62 -
 63
63 -
64
-
65
-
66
-
67
-
68
-
69
-
70
-
71
-
72
-
73
-
74
-
75
-
76
-
77
-
78
-
79
-
80
-
81
-
82
-
83
-
84
-
85
-
86
-
87
-
88
-
89
-
90
-
91
-
92
-
93
-
94
-
95
-
96
-
97
-
98
-
99
-
100
-
101
-
102
-
103
-
104
-
105
-
106
-
107
-
108
-
109
-
110
-
111
-
112
-
113
-
114
-
115
-
116
-
117
-
118
-
119
 |
 |

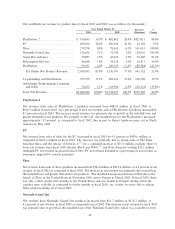
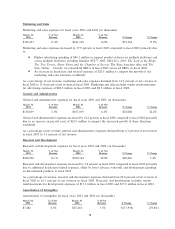
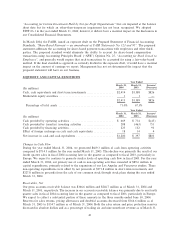
Marketing and Sales
Marketing and sales expenses for Ñscal years 2003 and 2002 (in thousands):
March 31, % of Net March 31, % of Net
2003 Revenue 2002 Revenue $ Change % Change
$332,453 13.4% $241,109 14.0% $91,344 37.9%
Marketing and sales expenses increased by 37.9 percent in Ñscal 2003 compared to Ñscal 2002 primarily due
to:
䡵Higher advertising spending of $46.1 million to support product releases on multiple platforms and
across multiple territories including Madden NFL
TM
2003, NBA Live 2003, The Lord of the Rings,
The Two Towers, Harry Potter and the Chamber of Secrets, The Sims franchise titles and The
Sims Online. Overall, we released 86 SKUs in Ñscal 2003 versus 64 SKUs in Ñscal 2002.
䡵An increase in headcount and related expenses of $20.5 million to support the growth of our
marketing and sales functions worldwide.
As a percentage of net revenue, marketing and sales expenses declined from 14.0 percent of net revenue in
Ñscal 2002 to 13.4 percent of net revenue in Ñscal 2003. Marketing and sales includes vendor reimbursements
for advertising expenses of $28.2 million in Ñscal 2003 and $8.9 million in Ñscal 2002.
General and Administrative
General and administrative expenses for Ñscal years 2003 and 2002 (in thousands):
March 31, % of Net March 31, % of Net
2003 Revenue 2002 Revenue $ Change % Change
$130,859 5.3% $107,059 6.2% $23,800 22.2%
General and administrative expenses increased by 22.2 percent in Ñscal 2003 compared to Ñscal 2002 primarily
due to an increase in payroll costs of $26.9 million to support the increased growth of these functions
worldwide.
As a percentage of net revenue, general and administrative expenses declined from 6.2 percent of net revenue
in Ñscal 2002 to 5.3 percent of net revenue.
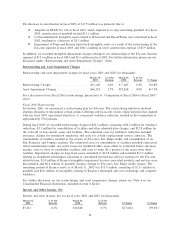
Research and Development
Research and development expenses for Ñscal years 2003 and 2002 (in thousands):
March 31, % of Net March 31, % of Net
2003 Revenue 2002 Revenue $ Change % Change
$400,990 16.1% $380,564 22.0% $20,426 5.4%
Research and development expenses increased by 5.4 percent in Ñscal 2003 compared to Ñscal 2002 primarily
due to additional headcount-related expenses, oÅset by lower advance write-oÅs and development spending
on discontinued products in Ñscal 2003.
As a percentage of revenue, research and development expenses declined from 22.0 percent of net revenue in
Ñscal 2002 to 16.1 percent of net revenue in Ñscal 2003. Research and development includes vendor
reimbursements for development expenses of $15.0 million in Ñscal 2003 and $17.0 million in Ñscal 2002.
Amortization of Intangibles
Amortization of intangibles for Ñscal years 2003 and 2002 (in thousands):
March 31, % of Net March 31, % of Net
2003 Revenue 2002 Revenue $ Change % Change
$7,482 0.3% $25,418 1.5% $(17,936) (70.6%)
38