Electronic Arts 2004 Annual Report Download - page 51
Download and view the complete annual report
Please find page 51 of the 2004 Electronic Arts annual report below. You can navigate through the pages in the report by either clicking on the pages listed below, or by using the keyword search tool below to find specific information within the annual report.-
 1
1 -
2
-
3
-
4
-
5
-
6
-
7
-
8
-
9
-
10
-
11
-
12
-
13
-
14
-
15
-
16
-
17
-
18
-
19
-
20
-
21
-
22
-
23
-
24
-
25
-
26
-
27
-
28
-
29
-
30
-
31
-
32
-
33
-
34
-
35
-
36
-
37
-
38
-
39
-
40
-
 41
41 -
 42
42 -
 43
43 -
 44
44 -
 45
45 -
 46
46 -
 47
47 -
 48
48 -
 49
49 -
 50
50 -
 51
51 -
 52
52 -
 53
53 -
 54
54 -
 55
55 -
 56
56 -
 57
57 -
 58
58 -
 59
59 -
 60
60 -
 61
61 -
62
-
63
-
64
-
65
-
66
-
67
-
68
-
69
-
70
-
71
-
72
-
73
-
74
-
75
-
76
-
77
-
78
-
79
-
80
-
81
-
82
-
83
-
84
-
85
-
86
-
87
-
88
-
89
-
90
-
91
-
92
-
93
-
94
-
95
-
96
-
97
-
98
-
99
-
100
-
101
-
102
-
103
-
104
-
105
-
106
-
107
-
108
-
109
-
110
-
111
-
112
-
113
-
114
-
115
-
116
-
117
-
118
-
119
 |
 |

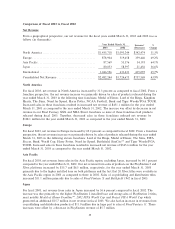
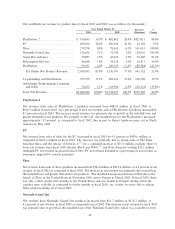
Our worldwide net revenue by product line for Ñscal 2003 and 2002 was as follows (in thousands):
Year Ended March 31, Increase/ %
2003 2002 (Decrease) Change
PlayStation 2ÏÏÏÏÏÏÏÏÏÏÏÏÏÏÏÏÏÏÏÏÏÏÏ $ 910,693 36.7% $ 482,882 28.0% $427,811 88.6%
PC ÏÏÏÏÏÏÏÏÏÏÏÏÏÏÏÏÏÏÏÏÏÏÏÏÏÏÏÏÏÏÏ 499,634 20.2% 456,292 26.5% 43,342 9.5%
Xbox ÏÏÏÏÏÏÏÏÏÏÏÏÏÏÏÏÏÏÏÏÏÏÏÏÏÏÏÏÏ 219,378 8.8% 78,363 4.5% 141,015 180.0%
Nintendo GameCubeÏÏÏÏÏÏÏÏÏÏÏÏÏÏÏÏ 176,656 7.1% 51,740 3.0% 124,916 241.4%
Game Boy Advance ÏÏÏÏÏÏÏÏÏÏÏÏÏÏÏÏÏ 79,093 3.2% 43,653 2.5% 35,440 81.2%
Subscription Services ÏÏÏÏÏÏÏÏÏÏÏÏÏÏÏÏ 44,648 1.8% 34,236 2.0% 10,412 30.4%
PlayStation ÏÏÏÏÏÏÏÏÏÏÏÏÏÏÏÏÏÏÏÏÏÏÏÏ 99,951 4.0% 189,535 11.0% (89,584) (47.3%)
EA Studio Net Product RevenueÏÏÏÏ 2,030,053 81.8% 1,336,701 77.5% 693,352 51.9%
Co-publishing and DistributionÏÏÏÏÏÏÏÏ 375,759 15.1% 269,010 15.6% 106,749 39.7%
Advertising, Programming, Licensing,
and Other ÏÏÏÏÏÏÏÏÏÏÏÏÏÏÏÏÏÏÏÏÏÏÏ 76,432 3.1% 118,964 6.9% (42,532) (35.8%)
Total Net RevenueÏÏÏÏÏÏÏÏÏÏÏÏÏÏÏÏÏÏ $2,482,244 100.0% $1,724,675 100.0% $757,569 43.9%
PlayStation 2
Net revenue from sales of PlayStation 2 products increased from $482.9 million in Ñscal 2002 to
$910.7 million in Ñscal 2003. As a percentage of total net revenue, sales of PlayStation 2 products increased by
8.7 percent in Ñscal 2003. The increase in net revenue was primarily due to growth in the installed base and
greater demand for our products. For example, in the U.S., the installed base for the PlayStation 2 increased
approximately 115 percent, as compared to Ñscal 2002, due in part to Sony's hardware price cut in North
America in May 2002.
PC
Net revenue from sales of titles for the PC increased in Ñscal 2003 by 9.5 percent to $499.6 million as
compared to $456.3 million in Ñscal 2002. The increase was primarily due to strong sales of The Sims
franchise titles, and the release of SimCity 4
TM
, for a combined increase of $71.0 million, partially oÅset by
lower net revenue from Ñscal 2002 releases Black and White
TM
and Dune Emperor totaling $32.2 million.
Although PC net revenue increased in Ñscal 2003, PC net revenue declined as a percentage of net revenue as
consumers migrated to console gameplay.
Xbox
Net revenue from sales of Xbox products increased from $78.4 million to $219.4 million, or 4.3 percent of net
revenue, in Ñscal 2003 as compared to Ñscal 2002. The increase in net revenue was primarily due to growth in
the installed base and greater demand for our products . The installed base increased in Ñscal 2003 due to the
launch of Xbox in the United States in November 2001 and in Europe in March 2002. In Ñscal 2002, there
was only a short period (Ñve months in the United States and one month in Europe) during which the
consoles were available as compared to twelve months in Ñscal 2003. As a result, we were able to release
Xbox products during all of Ñscal 2003.
Nintendo GameCube
Net revenue from Nintendo GameCube products increased from $51.7 million to $176.7 million, or
4.1 percent of net revenue, in Ñscal 2003 as compared to Ñscal 2002. The increase in net revenue for Ñscal 2003
was primarily due to growth in the installed base of the Nintendo GameCube, which was available in every
36