Electronic Arts 2004 Annual Report Download - page 26
Download and view the complete annual report
Please find page 26 of the 2004 Electronic Arts annual report below. You can navigate through the pages in the report by either clicking on the pages listed below, or by using the keyword search tool below to find specific information within the annual report.-
 1
1 -
2
-
3
-
4
-
5
-
6
-
7
-
8
-
9
-
10
-
11
-
12
-
13
-
14
-
15
-
 16
16 -
 17
17 -
 18
18 -
 19
19 -
 20
20 -
 21
21 -
 22
22 -
 23
23 -
 24
24 -
 25
25 -
 26
26 -
 27
27 -
 28
28 -
 29
29 -
 30
30 -
 31
31 -
 32
32 -
 33
33 -
 34
34 -
 35
35 -
 36
36 -
37
-
38
-
39
-
40
-
41
-
42
-
43
-
44
-
45
-
46
-
47
-
48
-
49
-
50
-
51
-
52
-
53
-
54
-
55
-
56
-
57
-
58
-
59
-
60
-
61
-
62
-
63
-
64
-
65
-
66
-
67
-
68
-
69
-
70
-
71
-
72
-
73
-
74
-
75
-
76
-
77
-
78
-
79
-
80
-
81
-
82
-
83
-
84
-
85
-
86
-
87
-
88
-
89
-
90
-
91
-
92
-
93
-
94
-
95
-
96
-
97
-
98
-
99
-
100
-
101
-
102
-
103
-
104
-
105
-
106
-
107
-
108
-
109
-
110
-
111
-
112
-
113
-
114
-
115
-
116
-
117
-
118
-
119
 |
 |
our products through distributors with whom we have written agreements or informal arrangements,
depending on the business customs of the territories.
In North America, we have stock-balancing programs for our PC products, which allow for the exchange of
PC products by resellers under certain circumstances. In all of our major geographical markets, we accept
product returns on our PC products and we may decide to accept product returns or provide price protection
under certain circumstances for our console products after we analyze inventory remaining in the channel,
the rate of inventory sell-through in the channel, and our remaining inventory on hand. It is our policy to
exchange products or give credits, rather than give cash refunds. We actively monitor and manage the volume
of our sales to retailers and distributors and their inventories as substantial overstocking in the distribution
channel can result in high returns or the requirement for substantial price protection in subsequent periods.
The distribution channels through which our games are sold have been characterized by change, including
consolidations and Ñnancial diÇculties of certain distributors and retailers. The bankruptcy or other business
diÇculties of a distributor or retailer could render our accounts receivable from such entity uncollectible,
which could have an adverse eÅect on our operating results and Ñnancial condition. In addition, an increasing
number of companies are competing for access to our distribution channels. Our arrangements with our
distributors and retailers may be terminated by either party at any time without cause. Distributors and
retailers often carry products that compete with ours. Retailers of our products typically have a limited amount
of shelf space and promotional resources that they are willing to devote to the software games category, and
there is intense competition for these resources. There can be no assurance that distributors and retailers will
continue to purchase our products or provide our products with adequate levels of shelf space and promotional
support.
Inventory and Working Capital
Our management focuses considerable attention to managing our inventories and other working-capital-
related items. We manage inventories by communicating with our customers prior to the release of our
products, and then using our industry experience to forecast demand on a product-by-product and territory-by-
territory basis. We then place manufacturing orders for our products that match this forecasted demand. We
do not maintain substantial inventories of our products because (1) historically, a substantial portion of a
particular product sales occur within the Ñrst 60-90 days after the product's release, and (2) the lead times on
re-orders of our products are generally short, approximately two to three weeks. Further, as discussed in
""Marketing and Distribution'' and in ""Management's Discussion and Analysis of Financial Condition and
Results of Operations'', we have practices in place with our customers (such as stock balancing and price
protection) that reduce product returns.
International Operations
We conduct business and have wholly-owned subsidiaries throughout the world, including oÇces in Australia,
Austria, Brazil, Canada, China, the Czech Republic, Denmark, England, Finland, France, Germany, Greece,
Hungary, Italy, Japan, the Netherlands, New Zealand, Norway, Poland, Portugal, Singapore, South Africa,
South Korea, Spain, Sweden, Switzerland, Taiwan, and Thailand. International net revenue increased by
29 percent to $1,348 million, or 45 percent of total net revenue in Ñscal 2004, compared to $1,047 million, or
42 percent of total net revenue in Ñscal 2003. Although we expect international revenue to grow in Ñscal 2005,
we do not believe it will continue to grow at the same rate as Ñscal 2004.
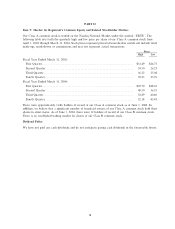
The amounts of net revenue and identiÑable assets attributable to each of our geographic regions for each of
the last three Ñscal years are set forth in Note 18 of the Notes to Consolidated Financial Statements, included
in Item 8 hereof.
11