Electronic Arts 2004 Annual Report Download - page 107
Download and view the complete annual report
Please find page 107 of the 2004 Electronic Arts annual report below. You can navigate through the pages in the report by either clicking on the pages listed below, or by using the keyword search tool below to find specific information within the annual report.-
 1
1 -
2
-
3
-
4
-
5
-
6
-
7
-
8
-
9
-
10
-
11
-
12
-
13
-
14
-
15
-
16
-
17
-
18
-
19
-
20
-
21
-
22
-
23
-
24
-
25
-
26
-
27
-
28
-
29
-
30
-
31
-
32
-
33
-
34
-
35
-
36
-
37
-
38
-
39
-
40
-
41
-
42
-
43
-
44
-
45
-
46
-
47
-
48
-
49
-
50
-
51
-
52
-
53
-
54
-
55
-
56
-
57
-
58
-
59
-
60
-
61
-
62
-
63
-
64
-
65
-
66
-
67
-
68
-
69
-
70
-
71
-
72
-
73
-
74
-
75
-
76
-
77
-
78
-
79
-
80
-
81
-
82
-
83
-
84
-
85
-
86
-
87
-
88
-
89
-
90
-
91
-
92
-
93
-
94
-
95
-
96
-
 97
97 -
 98
98 -
 99
99 -
 100
100 -
 101
101 -
 102
102 -
 103
103 -
 104
104 -
 105
105 -
 106
106 -
 107
107 -
 108
108 -
 109
109 -
 110
110 -
 111
111 -
 112
112 -
 113
113 -
 114
114 -
 115
115 -
 116
116 -
 117
117 -
118
-
119
 |
 |

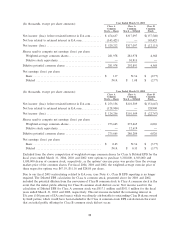
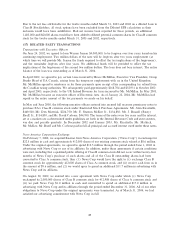
(19) QUARTERLY FINANCIAL AND MARKET INFORMATION (UNAUDITED)
(In thousands, except per share data) Quarter Ended
June 30 Sept. 30 Dec. 31 March 31 Year Ended
Fiscal 2004 Consolidated
Net revenue ÏÏÏÏÏÏÏÏÏÏÏÏÏÏÏÏÏÏÏÏÏÏ $353,381 $530,005 $1,475,323 $598,432 $2,957,141
Gross ProÑt ÏÏÏÏÏÏÏÏÏÏÏÏÏÏÏÏÏÏÏÏÏÏ 203,418 316,243 962,068 372,462 1,854,191
Operating income ÏÏÏÏÏÏÏÏÏÏÏÏÏÏÏÏÏ 21,772 101,867 557,508 94,450 775,597
Net income ÏÏÏÏÏÏÏÏÏÏÏÏÏÏÏÏÏÏÏÏÏÏ 18,368(a) 76,588(b) 392,296(c) 90,040(d) 577,292
Class A Stockholders
Net income per share - basic ÏÏÏÏÏÏÏÏ $ 0.06 $ 0.26 $ 1.32 $ 0.30 $ 1.95
Net income per share - diluted ÏÏÏÏÏÏ $ 0.06 $ 0.25 $ 1.26 $ 0.29 $ 1.87
Common stock price per share
High ÏÏÏÏÏÏÏÏÏÏÏÏÏÏÏÏÏÏÏÏÏÏÏÏÏÏ $ 39.70 $ 48.50 $ 52.89 $ 52.18 $ 52.89
LowÏÏÏÏÏÏÏÏÏÏÏÏÏÏÏÏÏÏÏÏÏÏÏÏÏÏÏ $ 28.10 $ 36.55 $ 40.60 $ 43.43 $ 28.10
Class B Stockholders
Net loss per share - basic ÏÏÏÏÏÏÏÏÏÏÏ N/A N/A N/A N/A N/A
Net loss per share - diluted ÏÏÏÏÏÏÏÏÏ N/A N/A N/A N/A N/A
Common stock price per share
High ÏÏÏÏÏÏÏÏÏÏÏÏÏÏÏÏÏÏÏÏÏÏÏÏÏÏ N/A N/A N/A N/A N/A
LowÏÏÏÏÏÏÏÏÏÏÏÏÏÏÏÏÏÏÏÏÏÏÏÏÏÏÏ N/A N/A N/A N/A N/A
Fiscal 2003 Consolidated
Net revenue ÏÏÏÏÏÏÏÏÏÏÏÏÏÏÏÏÏÏÏÏÏÏ $331,898 $453,490 $1,233,726 $463,130 $2,482,244
Gross ProÑt ÏÏÏÏÏÏÏÏÏÏÏÏÏÏÏÏÏÏÏÏÏÏ 189,444 252,623 668,615 298,760 1,409,442
Operating income ÏÏÏÏÏÏÏÏÏÏÏÏÏÏÏÏÏ 6,282 71,246 369,123 9,576 456,227
Net income ÏÏÏÏÏÏÏÏÏÏÏÏÏÏÏÏÏÏÏÏÏÏ 7,404(e) 50,234(e) 250,219(f) 9,240(g) 317,097
Class A Stockholders
Net income per share - basic ÏÏÏÏÏÏÏÏ $ 0.03 $ 0.19 $ 0.89 $ 0.04 $ 1.17
Net income per share - diluted ÏÏÏÏÏÏ $ 0.03 $ 0.17 $ 0.85 $ 0.03 $ 1.08
Common stock price per share
High ÏÏÏÏÏÏÏÏÏÏÏÏÏÏÏÏÏÏÏÏÏÏÏÏÏÏ $ 33.49 $ 34.50 $ 36.22 $ 30.23 $ 36.22
LowÏÏÏÏÏÏÏÏÏÏÏÏÏÏÏÏÏÏÏÏÏÏÏÏÏÏÏ $ 26.75 $ 26.23 $ 25.08 $ 23.76 $ 23.76
Class B Stockholders
Net loss per share - basic ÏÏÏÏÏÏÏÏÏÏÏ $ (0.49) $ (0.57) $ (0.86) $ (1.18) $ (2.77)
Net loss per share - diluted ÏÏÏÏÏÏÏÏÏ $ (0.49) $ (0.57) $ (0.86) $ (1.18) $ (2.77)
Common stock price per share
High ÏÏÏÏÏÏÏÏÏÏÏÏÏÏÏÏÏÏÏÏÏÏÏÏÏÏ N/A N/A N/A N/A N/A
LowÏÏÏÏÏÏÏÏÏÏÏÏÏÏÏÏÏÏÏÏÏÏÏÏÏÏÏ N/A N/A N/A N/A N/A
(a) Net income includes amortization of intangibles of $0.5 million, net of taxes.
(b) Net income includes amortization of intangibles of $0.6 million, net of taxes.
(c) Net income includes restructuring charges of $0.4 million, net of taxes, and amortization of intangibles of
$0.4 million, net of taxes.
(d) Net income includes restructuring charges of $6.4 million, net of taxes, amortization of intangibles of
$0.4 million, net of taxes and a reversal of previously accrued income taxes of $19.7 million.
(e) Net income includes amortization of intangibles of $1.6 million, net of taxes.
(f) Net income includes restructuring charges of $5.4 million, net of taxes, and asset impairment charges of
$1.0 million, net of taxes, as well as amortization of intangibles of $1.5 million, net of taxes.
(g) Net income includes restructuring charges of $5.0 million, net of taxes, and asset impairment charges of
$44.8 million, net of taxes, as well as amortization of intangibles of $0.5 million, net of taxes.
The Company's Class A common stock is traded on the Nasdaq National Market under the symbol ""ERTS''.
The prices for the Class A common stock in the table above represent the high and low sales prices as
reported on the Nasdaq National Market.
92