Electronic Arts 2004 Annual Report Download - page 40
Download and view the complete annual report
Please find page 40 of the 2004 Electronic Arts annual report below. You can navigate through the pages in the report by either clicking on the pages listed below, or by using the keyword search tool below to find specific information within the annual report.-
 1
1 -
2
-
3
-
4
-
5
-
6
-
7
-
8
-
9
-
10
-
11
-
12
-
13
-
14
-
15
-
16
-
17
-
18
-
19
-
20
-
21
-
22
-
23
-
24
-
25
-
26
-
27
-
28
-
29
-
 30
30 -
 31
31 -
 32
32 -
 33
33 -
 34
34 -
 35
35 -
 36
36 -
 37
37 -
 38
38 -
 39
39 -
 40
40 -
 41
41 -
 42
42 -
 43
43 -
 44
44 -
 45
45 -
 46
46 -
 47
47 -
 48
48 -
 49
49 -
 50
50 -
51
-
52
-
53
-
54
-
55
-
56
-
57
-
58
-
59
-
60
-
61
-
62
-
63
-
64
-
65
-
66
-
67
-
68
-
69
-
70
-
71
-
72
-
73
-
74
-
75
-
76
-
77
-
78
-
79
-
80
-
81
-
82
-
83
-
84
-
85
-
86
-
87
-
88
-
89
-
90
-
91
-
92
-
93
-
94
-
95
-
96
-
97
-
98
-
99
-
100
-
101
-
102
-
103
-
104
-
105
-
106
-
107
-
108
-
109
-
110
-
111
-
112
-
113
-
114
-
115
-
116
-
117
-
118
-
119
 |
 |

thereof, developments in tax audit matters, and estimated level of annual pre-tax income can aÅect the overall
eÅective income tax rate. For example, in the fourth quarter of Ñscal 2004, we resolved certain tax-related
matters with the Internal Revenue Service, which lowered our income tax expense by $19.7 million and
resulted in a 2.5 percent rate reduction.
RESULTS OF OPERATIONS
Our Ñscal year is reported on a 52/53-week period that ends on the Ñnal Saturday of March in each year. The
results of operations for the Ñscal years ended March 31, 2004, 2003 and 2002 each contain 52 weeks and
ended on March 27, 2004, March 29, 2003 and March 30, 2002, respectively. For simplicity of presentation,
all Ñscal periods are treated as ending on a calendar month end.
On October 20, 2003, our Board of Directors authorized a two-for-one stock split of our Class A common
stock which was distributed on November 17, 2003 in the form of a stock dividend for shareholders of record
at the close of business on November 3, 2003. All issued and outstanding share and per-share amounts related
to the Class A common stock have been restated to reÖect the stock split for all periods presented.
Comparison of Fiscal 2004 to Fiscal 2003
Net Revenue
We principally derive net revenue from sales of packaged interactive software games designed for play on
videogame consoles (such as the PlayStation 2, Xbox and Nintendo GameCube), PCs and hand-held game
machines (such as the Nintendo Game Boy Advance). Additionally, in Europe and Asia we generate a
signiÑcant portion of net revenue by marketing and selling third-party interactive software games through our
established distribution network. We also derive net revenue from selling subscriptions to online games,
programming third-party web sites, allowing other companies to manufacture and sell our products in
conjunction with other products, and selling advertisements on our online web pages.
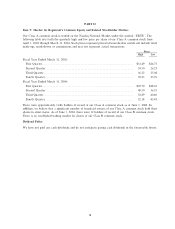
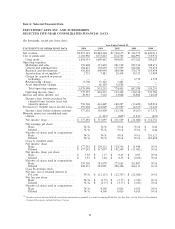
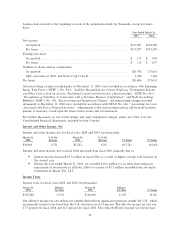
From a geographical perspective, our net revenue for the Ñscal years ended March 31, 2004 and 2003 was as
follows (in thousands):
Year Ended March 31, Increase/ %
2004 2003 (Decrease) Change
North America ÏÏÏÏÏÏÏÏÏÏÏÏÏÏÏÏÏÏÏÏÏÏÏÏÏÏÏÏÏÏÏÏÏÏÏÏ $1,609,539 $1,435,718 $173,821 12.1%
Europe ÏÏÏÏÏÏÏÏÏÏÏÏÏÏÏÏÏÏÏÏÏÏÏÏÏÏÏÏÏÏÏÏÏÏÏÏÏÏÏÏÏÏÏ 1,180,274 878,904 301,370 34.3%
Asia PaciÑc ÏÏÏÏÏÏÏÏÏÏÏÏÏÏÏÏÏÏÏÏÏÏÏÏÏÏÏÏÏÏÏÏÏÏÏÏÏÏÏ 96,708 87,569 9,139 10.4%
Japan ÏÏÏÏÏÏÏÏÏÏÏÏÏÏÏÏÏÏÏÏÏÏÏÏÏÏÏÏÏÏÏÏÏÏÏÏÏÏÏÏÏÏÏÏ 70,620 80,053 (9,433) (11.8%)
International ÏÏÏÏÏÏÏÏÏÏÏÏÏÏÏÏÏÏÏÏÏÏÏÏÏÏÏÏÏÏÏÏÏÏÏÏÏÏ 1,347,602 1,046,526 301,076 28.8%
Consolidated Net Revenue ÏÏÏÏÏÏÏÏÏÏÏÏÏÏÏÏÏÏÏÏÏÏÏÏÏÏ $2,957,141 $2,482,244 $474,897 19.1%
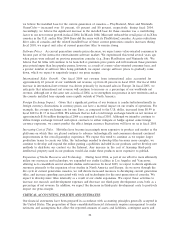
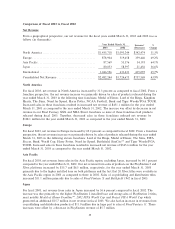
North America
For Ñscal 2004, net revenue in North America increased by 12.1 percent as compared to Ñscal 2003. From a
franchise perspective, the net revenue increase was primarily driven by higher sales of products released
during the year ended March 31, 2004 in the following eight franchises: Need for Speed
TM
, NBA STREET,
NFL STREET, Madden NFL, Def Jam
TM
, SSX, Tiger Woods/PGA TOUR@ and MVP Baseball
TM
.
Increased sales in these franchises resulted in increased net revenue of $353.2 million for the year ended
March 31, 2004 as compared to the year ended March 31, 2003. Increases in net revenue from these
franchises were partially oÅset by (1) a decrease in our Harry Potter franchise, as the Ñscal 2004 title, Harry
Potter
TM
: Quidditch
TM
World Cup, had no associated movie release, while our Ñscal 2003 product, Harry
Potter and the Chamber of Secrets
TM
, was released in conjunction with the blockbuster movie of the same title,
(2) the termination of our Square EA joint venture agreement, and (3) a decrease in net revenue in our
25