Electronic Arts 2004 Annual Report Download - page 103
Download and view the complete annual report
Please find page 103 of the 2004 Electronic Arts annual report below. You can navigate through the pages in the report by either clicking on the pages listed below, or by using the keyword search tool below to find specific information within the annual report.-
 1
1 -
2
-
3
-
4
-
5
-
6
-
7
-
8
-
9
-
10
-
11
-
12
-
13
-
14
-
15
-
16
-
17
-
18
-
19
-
20
-
21
-
22
-
23
-
24
-
25
-
26
-
27
-
28
-
29
-
30
-
31
-
32
-
33
-
34
-
35
-
36
-
37
-
38
-
39
-
40
-
41
-
42
-
43
-
44
-
45
-
46
-
47
-
48
-
49
-
50
-
51
-
52
-
53
-
54
-
55
-
56
-
57
-
58
-
59
-
60
-
61
-
62
-
63
-
64
-
65
-
66
-
67
-
68
-
69
-
70
-
71
-
72
-
73
-
74
-
75
-
76
-
77
-
78
-
79
-
80
-
81
-
82
-
83
-
84
-
85
-
86
-
87
-
88
-
89
-
90
-
91
-
92
-
 93
93 -
 94
94 -
 95
95 -
 96
96 -
 97
97 -
 98
98 -
 99
99 -
 100
100 -
 101
101 -
 102
102 -
 103
103 -
 104
104 -
 105
105 -
 106
106 -
 107
107 -
 108
108 -
 109
109 -
 110
110 -
 111
111 -
 112
112 -
 113
113 -
114
-
115
-
116
-
117
-
118
-
119
 |
 |

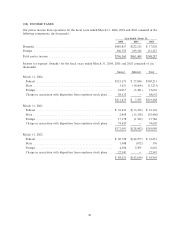
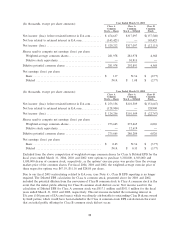
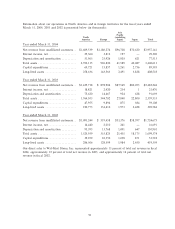
Year Ended March 31, 2003
(In thousands, except per share amounts): Class A Class A Class B
Common Common Common
Stock Ì Basic Stock Ì Diluted Stock
Net income (loss) before retained interest in EA.com ÏÏÏÏÏÏÏ $ 474,637 $317,097 $(157,540)
Net loss related to retained interest in EA.comÏÏÏÏÏÏÏÏÏÏÏÏÏ (145,425) Ì 145,425
Net income (loss) ÏÏÏÏÏÏÏÏÏÏÏÏÏÏÏÏÏÏÏÏÏÏÏÏÏÏÏÏÏÏÏÏÏÏÏÏÏ $ 329,212 $317,097 $ (12,115)
Shares used to compute net earnings (loss) per share:
Weighted-average common sharesÏÏÏÏÏÏÏÏÏÏÏÏÏÏÏÏÏÏÏÏÏÏ 281,978 281,978 4,368
Dilutive stock equivalents ÏÏÏÏÏÏÏÏÏÏÏÏÏÏÏÏÏÏÏÏÏÏÏÏÏÏÏÏÏ Ì 10,913 Ì
Dilutive potential common shares ÏÏÏÏÏÏÏÏÏÏÏÏÏÏÏÏÏÏÏÏÏÏÏÏ 281,978 292,891 4,368
Net earnings (loss) per share:
Basic ÏÏÏÏÏÏÏÏÏÏÏÏÏÏÏÏÏÏÏÏÏÏÏÏÏÏÏÏÏÏÏÏÏÏÏÏÏÏÏÏÏÏÏÏÏÏ $ 1.17 N/A $ (2.77)
Diluted ÏÏÏÏÏÏÏÏÏÏÏÏÏÏÏÏÏÏÏÏÏÏÏÏÏÏÏÏÏÏÏÏÏÏÏÏÏÏÏÏÏÏÏÏ N/A $ 1.08 $ (2.77)
Year Ended March 31, 2002
(In thousands, except per share amounts): Class A Class A Class B
Common Common Common
Stock Ì Basic Stock Ì Diluted Stock
Net income (loss) before retained interest in EA.com ÏÏÏÏÏÏÏ $ 253,156 $101,509 $(151,647)
Net loss related to retained interest in EA.comÏÏÏÏÏÏÏÏÏÏÏÏÏ (128,900) Ì 128,900
Net income (loss) ÏÏÏÏÏÏÏÏÏÏÏÏÏÏÏÏÏÏÏÏÏÏÏÏÏÏÏÏÏÏÏÏÏÏÏÏÏ $ 124,256 $101,509 $ (22,747)
Shares used to compute net earnings (loss) per share:
Weighted-average common sharesÏÏÏÏÏÏÏÏÏÏÏÏÏÏÏÏÏÏÏÏÏÏ 273,665 273,665 6,026
Dilutive stock equivalents ÏÏÏÏÏÏÏÏÏÏÏÏÏÏÏÏÏÏÏÏÏÏÏÏÏÏÏÏÏ Ì 12,619 Ì
Dilutive potential common shares ÏÏÏÏÏÏÏÏÏÏÏÏÏÏÏÏÏÏÏÏÏÏÏÏ 273,665 286,284 6,026
Net earnings (loss) per share:
Basic ÏÏÏÏÏÏÏÏÏÏÏÏÏÏÏÏÏÏÏÏÏÏÏÏÏÏÏÏÏÏÏÏÏÏÏÏÏÏÏÏÏÏÏÏÏÏ $ 0.45 N/A $ (3.77)
Diluted ÏÏÏÏÏÏÏÏÏÏÏÏÏÏÏÏÏÏÏÏÏÏÏÏÏÏÏÏÏÏÏÏÏÏÏÏÏÏÏÏÏÏÏÏ N/A $ 0.35 $ (3.77)
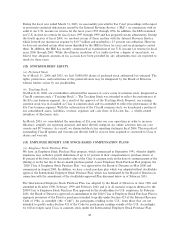
Excluded from the above computation of weighted-average common shares for Class A Diluted EPS for the
Ñscal years ended March 31, 2004, 2003 and 2002 were options to purchase 3,218,000, 6,303,000 and
3,030,000 shares of common stock, respectively, as the options' exercise price was greater than the average
market price of the common shares. For Ñscal 2004, 2003 and 2002, the weighted-average exercise price of
these respective options was $47.19, $31.16 and $28.83 per share.
Due to our Ñscal 2003 restructuring related to EA.com, (see Note 6), Class B EPS reporting is no longer
required. The Diluted EPS calculation for Class A common stock, presented above for 2003 and 2002,
included the potential dilution from the conversion of Class B common stock to Class A common stock in the
event that the initial public oÅering for Class B common stock did not occur. Net income used for the
calculation of Diluted EPS for Class A common stock was $317.1 million and $101.5 million for the Ñscal
years ended March 31, 2003 and 2002, respectively. This net income included the remaining interest in
EA.com (100 percent of EA.com losses) which was directly attributable to outstanding Class B shares owned
by third parties, which would have been included in the Class A common stock EPS calculation in the event
that an initial public oÅering for Class B common stock did not occur.
88